Investment briefing
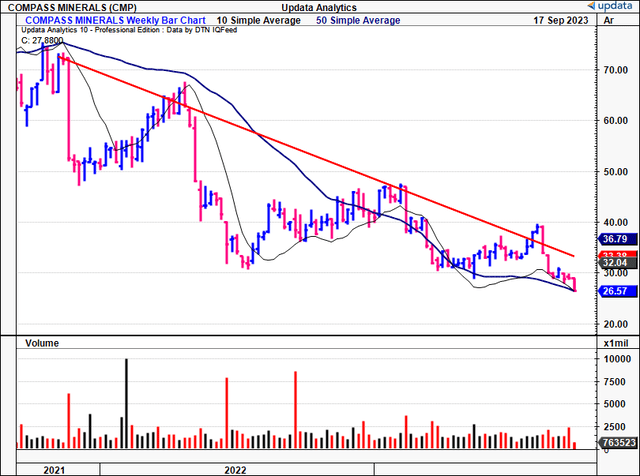
No relief for Compass Minerals International, Inc. (NYSE:CMP)’s shareholders leading into the back end of the year, with the company’s equity stock attracting offers at 2-year lows as I write (Figure 1).
As a reminder, CMP produces essential minerals, namely salt, sulfate of potash and specialty fertilizers. Its core assets are 12 production and packaging facilities—two of which are the largest rock salt mines in the world and the U.K. respectively. It operates in 2 divisions, salt, and plant nutrition.
But CMP is a low-margin, low capital turnover business, something you’ll see mentioned several times throughout this report. The company’s asset-heaviness isn’t appealing in a time of inflationary pressure, adding to replacement costs and limiting the ability to fund growth CapEx + investments. What’s more, the company’s core assets aren’t throwing off attractive levels of cash or profits, leading to single-digit returns on capital since 2020 at least. This report will unpack the economic value CMP has foregone for its shareholders and link this back to the broader hold thesis. Net-net, the market has CMP priced appropriately at its current levels in my view. Rate hold.
Figure 1.
Data: Updata
Critical investment facts underlining hold thesis
1. Q3 FY’23 insights—sales, yearend forecasts down
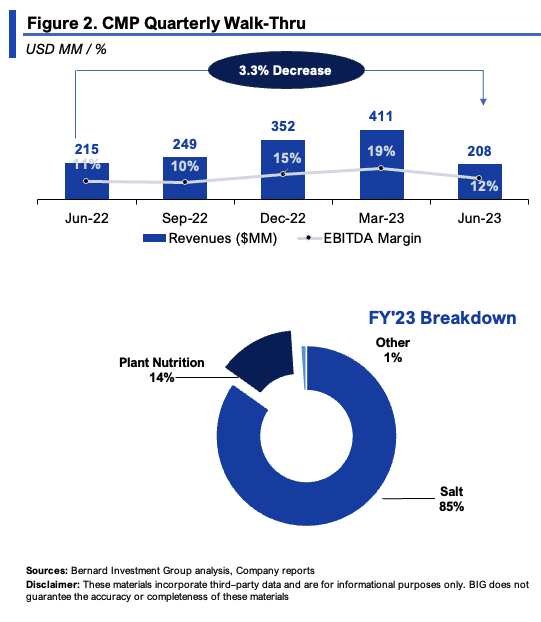
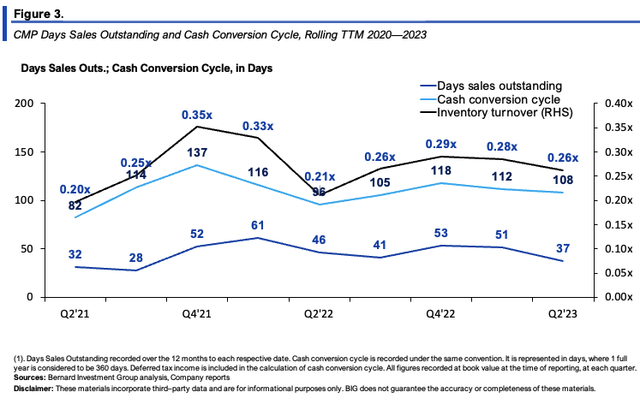
CMP clipped Q3 revenues of $208mm, down ~3% YoY on adj. EBITDA of $28.6mm. Earnings of $40mm were impacted by a $43mm tax benefit resulting from the Fortress acquisition (discussed later). The downsides were felt throughout the P&L and cash flows. I’d note the company’s cash conversion cycle has pushed to 108 days from 82 days in 2020, whilst its turnover of inventory remains within the 0.2–0.3x band (see: Figure 3).
Given the number of hurdles faced this YTD, management has narrowed in guidance and forecasts $$1.14—$1.2Bn at the top line, calling for ~360bps downside at the top from FY’22. With respect to volumes, in its salt business, it looks to moving 11—11.55mm tonnes of mineral, and 200–225,000 tonnes in its plant nutrition segment. It is eyeing $235mm and $50mm in adj. EBITDA on these at the upper end of range, respectively. CapEx forecasts have been tightened in to $130—$150mm with a $20–$25mm reduction in CapEx with its lithium carbonate assets.
Back to Q3, there were many divisional highlights, including the following:
-
Salt segment—CMP’s salt segment was flat YoY and did $156mm of business for the quarter, despite a decline of 11% in volumes. Pricing did increase by 12% YoY, which contributed to the stability. Sales volume for the highway deicing business decreased by 13%, offset by a 16% YoY increase in highway deicing prices to ~$74 per tonne. Salt’s operating income was up ~75% YoY, to $21.7mm (due to pricing), with a 50% increase in adj. EBITDA per tonne to $24.41.
-
Plant nutrition—Its plant nutrition business was also flat due to pricing dynamics in the third quarter. The average selling price (“ASP”) decreased by 9% YoY and 6% sequentially to $750/tonne, resulting in a 15% YoY decrease in revenue to c.$48mm. Volumes were down on this as well. The YTD breakdown, along with the YoY sales walkthrough, is seen in Figure 2.
BIG Insights
Additional Q3 key takeaways:
-
Regarding its Great Salt Lake (“GSL”) lithium assets, CMP secured a binding multi-year agreement with Ford Motor Company (F) in May. Under the terms, it is committing to providing up to 40% of Ford’s planned phase-one battery-grade lithium carbonate once production starts at the site. This, alongside an existing agreement with LG Energy Solution, makes up 80% of the commitments for the planned phase-one production at GSL. I’d note this is a potential tailwind downstream, and would encourage all readers to pay close attention to further production updates at GSL.
-
The company completed the acquisition of the outstanding 55% equity of fire retardant company Fortress during the quarter as well. Management noted that Fortress is actively supporting multiple air tanker bases during the 2023 fire season, which spans from spring to fall.
BIG Insights
2. Economic analysis of performance
As mentioned earlier, CMP is a low-margin, low capital turnover business, built on an asset-heavy model. Inflationary times are difficult for asset-intensive businesses, ultimately crimping earnings power downstream.
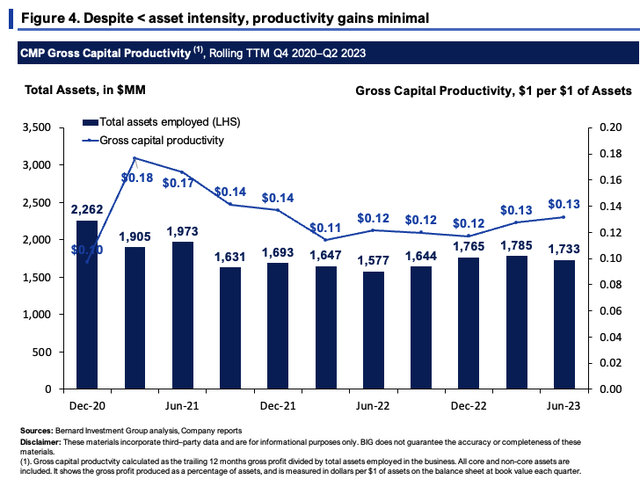
This wouldn’t be such an issue if the asset base was productive and overwhelmingly profitable. But it isn’t. Figure 4 outlines this at the gross level, showing the gross capital productivity produced on each $1 of assets. All core and non-core assets are displayed. From 2020–date, the company has rotated just $0.13–$0.18 in gross profit per $1 in assets. As a productivity measure, I’d be looking closer to the $0.25–$0.30 on the dollar range, so we’re well off the mark here.
BIG Insights
Historical analysis of the returns CMP has produced on its capital is a fruitful exercise to gauge what economic value is on the table. I’m after (i) high returns on capital deployed, and (ii) evidence of productive core assets to position against.
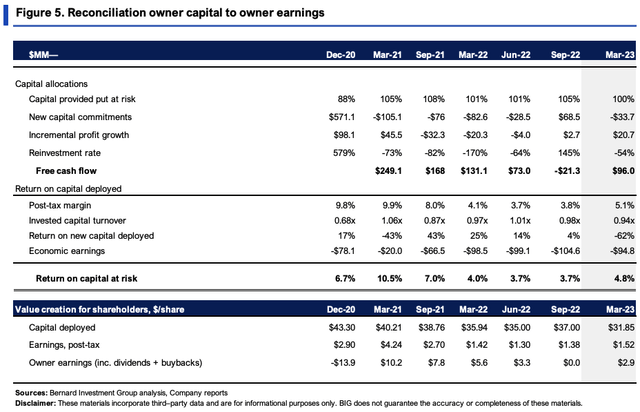
Investors had provided the firm $1.31Bn in total capital (debt, equity) by Q3, of which 100% had been put to work in its core assets outlined in the investment briefing, equating to $31.85/share [Figure 5]. The $31.85/share produced $1.52/share in post-tax earnings for a 4.8% return on investment. Unfortunately, both post-tax margin and capital turns are low, 5.1% and 0.94x respectively, causing the unattractive returns. To me, this speaks of a capital-intensive business where investment needs a high, and profit production is low.
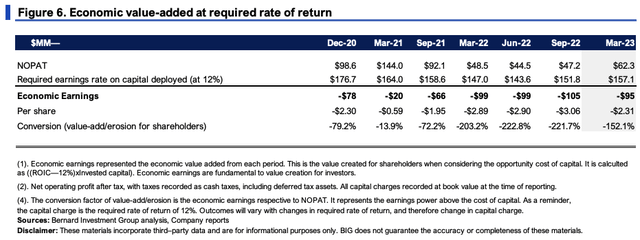
We employ a 12% required rate of return on all potential equity holdings. Under this convention, this resulted in an economic loss of 7.2% or ~$95mm in monetary terms in Q3 (TTM values). Turning an economic profit is undoubtedly the desirable outcome, so this is a potential red flag. Figure 6 displays what the company needed to have produced in NOPAT in order to meet the 12% threshold, versus what it has done, since 2020. Still, CMP printed $96mm in TTM FCF in Q3 after a number of asset disposals, throwing off $2.90/share in cash including all dividends paid up.
BIG Insights
BIG Insights
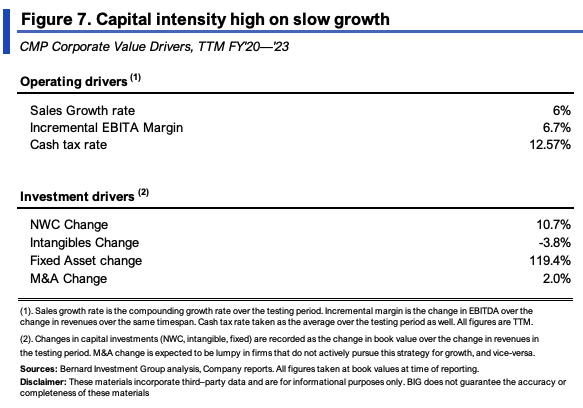
The company’s value drivers from the last 3 years are shown in Figure 7. The operating drivers give insight into the incremental NOPAT CMP has produced, whereas the investment drivers show what the capital requirements were. Combined, you get an insight into incremental FCF.
Sales grew at a compounding rate of 6% over this time with an average 6.7% operating margin. For every new $1 in sales, CMP had to invest $1.19 in fixed capital, with just $0.10 required in NWC. So the majority of investment has been towards fixed assets, which squares off with the economics of the business.
BIG Insights
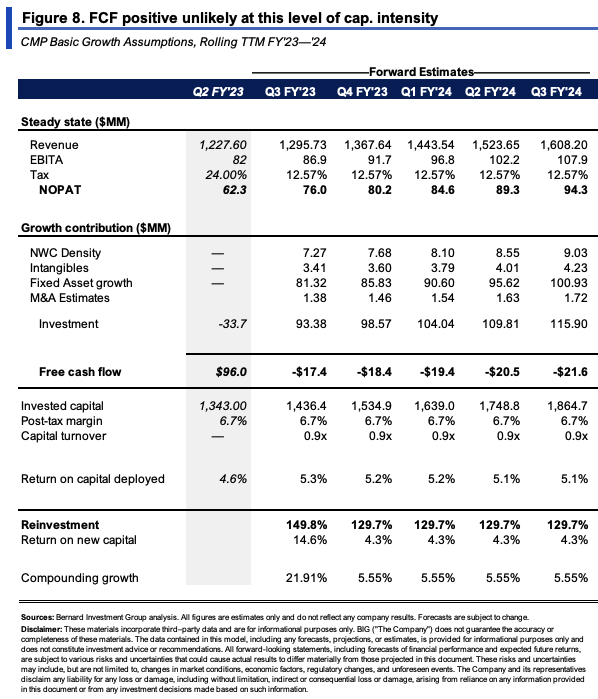
I’ve carried some of these assumptions forward into the model shown in Figure 8, to gauge what CMP’s requirements would be to maintain this pace of growth. As you can see, a 6% growth rate doesn’t appear sustainable for the company at this stage. It would require ~130% of NOPAT to be reinvested each quarter—around $94–$115mm of investment ($376–$460mm annualized)—the bulk of which into fixed capital. Remaining FCF positive would therefore be unlikely in my view. At a 3% forward growth rate (just ahead of global GDP) it would still need 70% of NOPAT reinvested to support said growth, to produce ~$20–$25mm of FCF each period. In both scenarios, CMP would only be compounding its intrinsic value at ~3–5% per period. Growth would therefore create little shareholder value in these scenarios. Note, these assumptions also assume a 12.6% tax rate, which is low for corporate standards. So a higher tax rate would have implications here as well.
BIG Insights
Valuation and conclusion
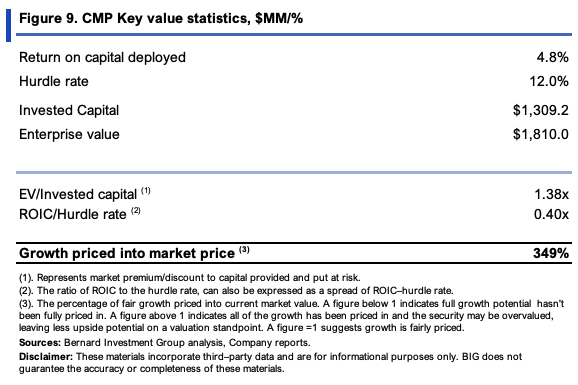
The stock sells at a premium to the sector at 55x forward earnings and 21.45x forward EBIT (291% and 86% premium, respectively). It has created $2.14 in market value for every $1 of net asset value. More specifically, investors have priced the company at a ~1.4x multiple of its invested capital. I’m immediately suspicious here, because as a reflection of the earnings power at its trailing ROIC, this implies a tremendous amount of “growth” is already priced into the company’s market value [Figure 9]. This effectively compares CMP’s business returns to its market returns on capital, so is another potential red flag for mine.
BIG Insights
I’ve brought the steady-state assumptions in Figure 8 out to FY’28, albeit with a 3% sales growth rate [Figure 10]. I’ve also compounded the firm’s equity line at the function of the implied ROIC and reinvestment rates. Discounting the projected FCFs and equity line back at our 12% hurdle rate, assigning a 50% weighting to each, implies a fair value of $28/share—basically where CMP sells today. In my view, this further supports a neutral rating.

Source: BIG Insights
In short, CMP is a low-margin, low capital turnover business that has not created economic value for shareholders these past 3 years on my assessment. By all measures, these trends may continue moving forward. The asset-heaviness of the business comes through at the gross and after-tax levels of income, where returns on capital employed are low. The allotted dividends paid each quarter aren’t enough to get me over the line here either. This report unpacked a number of factors relating to the economics of CMP’s operations and what the requirements + expectations would be heading forward. Net-net, I rate CMP a hold, exploring more selective opportunities elsewhere.
Read the full article here


