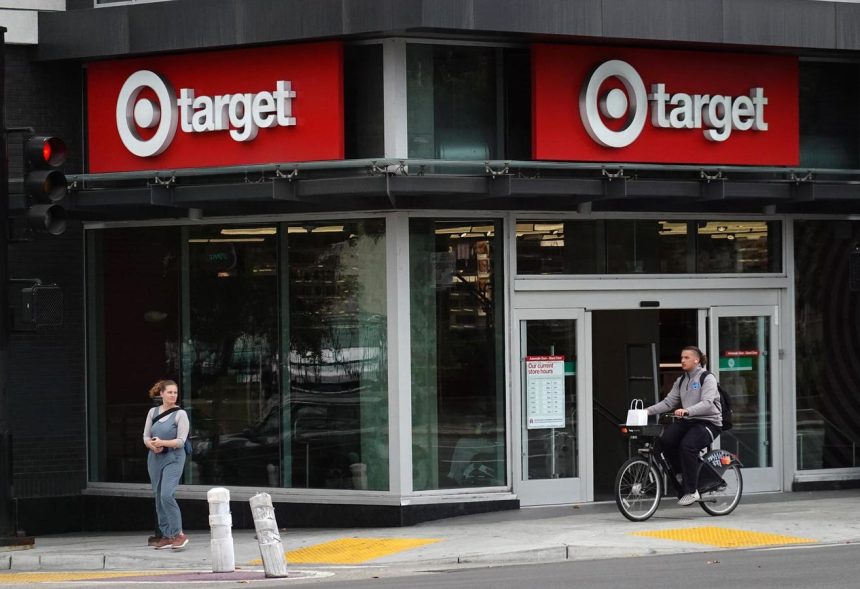
Target (NYSE: TGT), the second-largest discount chain in the U.S., is scheduled to report its fiscal third-quarter results on Wednesday, November 15. We expect Target’s
TGT
TGT stock has suffered a sharp decline of 40% from levels of $175 in early January 2021 to the current levels, vs. an increase of about 20% for the S&P 500 over this roughly 3-year period. However, the decrease in TGT stock has been far from consistent. Returns for the stock were 31% in 2021, -36% in 2022, and -28% in 2023 (YTD). In comparison, returns for the S&P 500 have been 27% in 2021, -19% in 2022, and 15% in 2023 (YTD) – indicating that TGT underperformed the S&P in 2022 and 2023. In fact, consistently beating the S&P 500 – in good times and bad – has been difficult over recent years for individual stocks; for heavyweights in the Consumer Staples sector including WMT, PG, and COST, and even for the megacap stars GOOG, TSLA, and MSFT. In contrast, the Trefis High Quality (HQ) Portfolio, with a collection of 30 stocks, has outperformed the S&P 500 each year over the same period. Why is that? As a group, HQ Portfolio stocks provided better returns with less risk versus the benchmark index; less of a roller-coaster ride as evident in HQ Portfolio performance metrics. Given the current uncertain macroeconomic environment with high oil prices and elevated interest rates, could TGT face a similar situation as it did in 2022 and 2023 and underperform the S&P over the next 12 months – or will it see a recovery?
Our forecast indicates that Target’s valuation is $138 per share, which is almost 28% higher than the current market price. Look at our interactive dashboard analysis on TGT’s Earnings Preview: What To Expect in Q3? for more details.
(1) Revenues expected to beat consensus estimates slightly
Trefis estimates Target’s Q3 2023 revenues to be around $25.7 Bil, slightly above the consensus estimate. Target’s Q2 revenue fell 5% year-over-year (y-o-y) to $25 billion due to a 5.4% decline in comparable sales. Further, comparable digital sales also fell 10.5% in Q2. However, the retailer lapped a period with unusually high inventory levels in the year-ago quarter and made progress on initiatives to improve its gross profit margin. Same-day fulfillment services, a longtime source of strength for the company, was up 4% with a 7% increase in Drive-Up. Going forward, we expect Target Revenues to reach $108.2 billion in fiscal 2023, down marginally y-o-y.
(2) EPS likely to be marginally above consensus estimates
TGT’s Q3 2023 earnings per share (EPS) is expected to be $1.52 per Trefis analysis, marginally above the consensus estimate. TGT reduced its inventory by 17% y-o-y, which helped drive gross margin up from 21.5% in Q2 2022 to 27% in Q2 2023. Consequently, Target’s operating income improved by 360 basis points to 4.8% and adjusted earnings per share quadrupled from $0.39 in Q2 2022 to $1.80 in Q2 2023.
(3) Stock price estimate higher than current market price
Going by our Target’s Valuation, with an EPS estimate of around $7.62 and a P/E multiple of 18.1x in fiscal 2023, this translates into a price of $138, which is almost 28% higher than the current market price.
It is helpful to see how its peers stack up. TGT Peers shows how Target’s stock compares against peers on metrics that matter. You will find other useful comparisons for companies across industries at Peer Comparisons.
Invest with Trefis Market-Beating Portfolios
See all Trefis Price Estimates
Read the full article here


