The S&P 500 (SPY) finally dipped this week following the CPI release, and broke some support levels with a 90% down day. However, one weak session does not make a reversal, and it bounced straight up again. As I highlighted last weekend, “Most important of all, look for new weekly lows on Thursday and Friday and a close at the low of the weekly range.” Clearly, this didn’t happen.
Some of the most useful technical analysis comes from using logic and analyzing price action rather than just identifying support and resistance. A bullish bar – be it daily, weekly or monthly – often tests lower than the open in the early stages of that time period (to flush out weak longs and test support), and then moves higher in the latter stages to close near the highs. Bulls are confident enough to hold full positions overnight or over the weekend. This recently happened five weeks in a row, and indeed, on Wednesday and Thursday. However, Friday’s weaker action broke the strong bullish action since the January low.
This weekend’s article will focus on the implications – if any – of this week’s moves and probable moves next week. Various techniques will be applied to multiple timeframes in a top-down process which also considers the major market drivers. The aim is to provide an actionable guide with directional bias, important levels, and expectations for future price action.
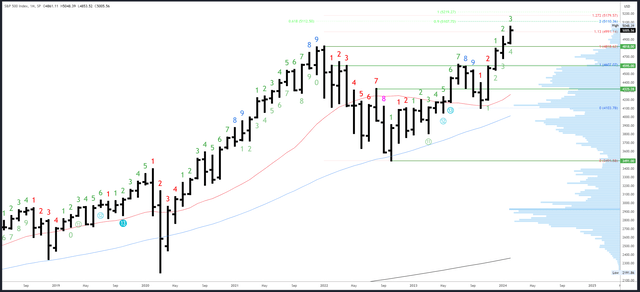
S&P 500 Monthly
Last week’s drop pushed the February bar back into the January range below 4931, but it spent only around an hour there and was solidly rejected. As long as the monthly close is above this level, there will be no real evidence of weakness.
As mentioned before, seasonality studies show the second half of February is one of the weakest two-week periods of the year. Dropping below 4853-61 would signal a proper bearish shift.

SPX Monthly (Tradingview)
Now that the S&P 500 is in “blue sky” at new all-time highs, Fibonacci extensions and measured moves act as a guide for targets. I have drawn in another measured move, which shows the 2022-2024 rally will be equal to 0.618* of the 2020-2021 rally at 5112. This might not seem much on its own, but it is in tight confluence with the 200% extension of the July-October correction and another measured move in the rally from the 2022 low. All measurements there lie in the 5107-5112 range, which make it potentially significant.
As mentioned earlier, 4853-61 is an important level on the downside. 4818 is the next major level at the previous all-time high.
There will be a long wait for the next monthly Demark signal. February is bar 3 (of a possible 9) in a new upside exhaustion count.
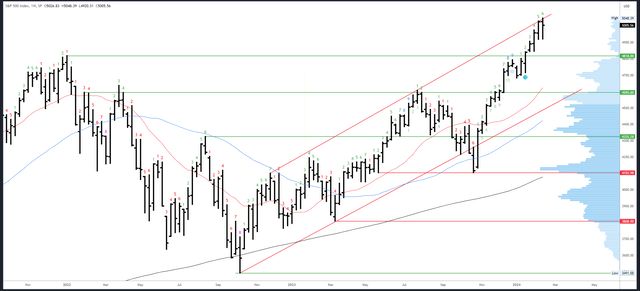
S&P 500 Weekly
The weekly channel highs held this week and provoked a downside reaction as expected. This disrupted the sequence of higher weekly closes in place since the January low, although a higher high and higher low were still made.
Closing the week off the highs means an immediate move higher in unlikely, and we may well see an inside week or other neutral bar form next week.

SPX Weekly (Tradingview)
Channel resistance will move up to around 5054. This likely holds into the weekly close but can easily be pushed through mid-week. The same Fib targets from the monthly chart apply, so 5107-5112 is the next target zone.
The 4918-20 double bottom is now near-term support. Under there, the small weekly gap from 4842-44 is the first important area.
An upside Demark exhaustion count will be on bar 7 (of 9) next week, so no exhaustion signal will register. A reaction is usually seen on weeks 8 or 9 – it’s getting closer!
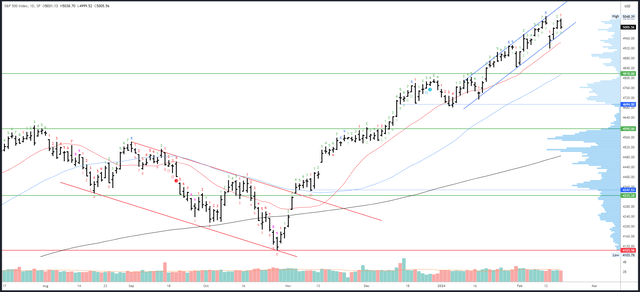
S&P 500 Daily
This week’s daily Demark exhaustion signal led to a reaction on Monday/Tuesday. This is the third time the signal has led to a sharp move down, but each time it has lasted exactly one day (20th December and 31st January are the previous reactions).
As pointed out last week, the rally has reached the top of the daily channel from the January low as well as the large weekly channel. The subsequent sell-off briefly broke the bottom support, but then recovered to close back inside. Along with the temporary break of 4975, this was a dent in the uptrend, but nothing too damaging or conclusive.

SPX Daily (Tradingview)
Channel resistance now rises to 5100 and increases around 10 points each session.
Channel support is 4990 on Tuesday and also increases around 10 points each session. I expect this channel will break and become less relevant. The 20dma is also in play and will be around 4950 on Tuesday. 4953-56 is the first horizontal support, and 4920 important below that.
A daily Demark exhaustion cannot complete next week.
Drivers/Events
This week’s data failed to deliver any positive news for stock markets. Hotter-than-expected CPI and PPI pushed back expectations for the first rate cut to June, while Retail Sales came in weak. Only three rate cuts are anticipated this year, which is finally in line with Fed projections.
The immediate reaction to the CPI report was logical, but the recovery perhaps less so. Stocks appear relatively indifferent to the shifting expectations for Fed policy, likely because the economy and earnings are doing OK. It seems the Fed’s monetary policy has less of a dramatic effect than many expected. The primary focus is therefore a stable and robust economy.
On this note, PMIs on Thursday are the highlight of next week. Claims are also on Thursday, and FOMC Minutes are on Wednesday. Markets are closed on Monday for President’s Day.
Probable Moves Next Week(s)
This week’s data and sharp dip have dented the uptrend, and any subsequent gains are likely much slower. Indeed, Friday’s weak session suggests the S&P 500 should take a step back on Tuesday’s re-open and drop to test the 4950-60 area.
As long as 4920 holds, the S&P 500 likely then drifts higher over the rest of the week in the absence of any significant data releases or events. A new high above 5048 could be made to around 5075, but gains are unlikely to hold. This kind of action could persist into the last week of February.
Ultimately, the destination could be the cluster of Fibonacci measurements in the 5107-112 area, where I expect the S&P 500 to roll over into a large correction.
A drop through 4920 and new weekly lows next Friday would be a warning the top may already be in. This is not necessarily my view, but it would change my mind from the expectations above towards a plan B which looks for 4842-44 support and the big test of the 4818 previous all-time high.
Read the full article here


