The concept behind funds like Fidelity Quality Factor ETF (NYSEARCA:FQAL), which offers higher quality exposure, is compelling. After all, investors are expected to favor highly profitable companies with healthy margins and good financial indicators.
However, the reality is far more complex, as many high-quality companies trade at premium valuations and price action does not always reflect a company’s underlying strong fundamentals.
That said, FQAL’s stock selection and allocation methodology do seem to bring better profitability measures to its compounded portfolio, along with slightly higher valuation multiples. Nevertheless, FQAL has consistently delivered a sub-par performance, lagging behind the broader market and other similar ETFs focusing on quality. Therefore, this fund would not be among my preferred alternatives in the quality ETFs category.
ETF Description & Highlights
FQAL is an exchange-traded fund that offers exposure to large and mid-capitalization U.S. companies with higher quality characteristics compared to the overall market, tracking the performance of the Fidelity U.S. Quality Factor Index.
This index aims to select companies that exhibit high and stable profitability levels. The first step in this process involves gauging companies’ quality based on a composite factor score, calculated as the average of three quality measures: 1) Free cash flow margin, 2) Return on invested capital, and 3) Free cash flow stability. Given the unique nature of the banking industry, its composite factor score is calculated instead by the average of the following two measures: Return on equity and debt to assets.
After an iterative process to adjust the factor score based on the company size, companies are selected within each sector following three ranges: a) Selection of top decile for sectors with more than 100 companies, b) Selection of top quintile for sectors with 25 to 100 companies, and c) selection of top tercile for sectors with fewer than 25 companies.
The selected companies within each sector are then weighted according to their market cap, with an overweight adjustment equally applied to all constituents to reduce weighting concentration in the final index.
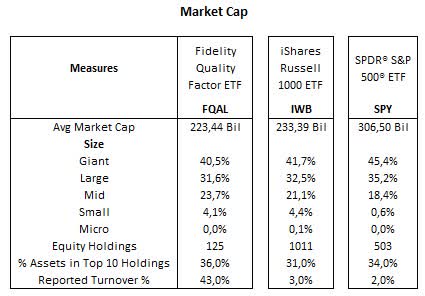
The result is an index with 125 constituents, according to the FQAL’s holdings, as of July 27, 2024. The average market cap is $223.4 billion, with an allocation of nearly 40.5% in mega caps, 31.6% in large caps, 23.7% in mid caps, and 4.1% in small caps, distributed across market cap categories similar to its benchmark, the Russell 1000 index, represented by the iShares Russell 1000 ETF (IWB).
FQAL’s top ten holdings (Apple (AAPL), Microsoft (MSFT), NVIDIA (NVDA), Alphabet (GOOG) (GOOGL), Meta (META), Berkshire (BRK.A) (BRK.B), Eli Lilly (LLY), Broadcom (AVGO), Johnson & Johnson (JNJ) and AbbVie (ABBV)) are primarily composed of mega tech stocks, mirroring the Russell 1000 index, with the inclusion of two healthcare players, Johnson & Johnson and AbbVie, and the absence of Amazon (AMZN), which alongside Tesla (TSLA) and JPMorgan (JPM), are the largest companies in the Russell 1000 index not selected to join FQAL’s portfolio.
Morningstar, consolidated by the author
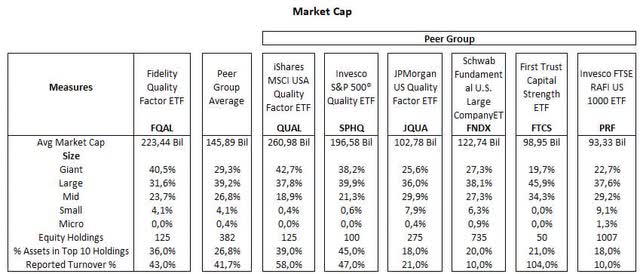
Below is a table that compares FQAL with a peer group of ETFs that predominately invest in large caps, divided into two subsets. The first group is composed of three ETFs (QUAL, SPHQ and JQUA) that, like FQAL, have an emphasis on quality stocks. The second group also includes three ETFs (FNDX, FTCS and PRF) with a more comprehensive fundamental approach, considering other measures such as sales, cash flow and valuations.
Morningstar, consolidated by the author
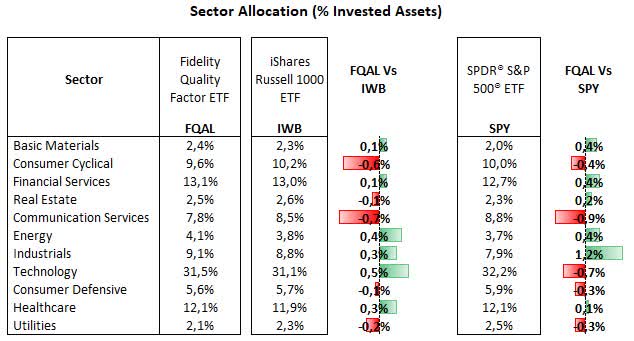
From a sector allocation perspective. FQAL’s largest allocation is to the technology sector, with 31.5% of total equities. This is followed by financial services at 13.1%, healthcare at 12.1%, consumer cyclical at 9.6%, and industrials at 9.1%. Communication services comprises 7.8%, with the energy sector at 4.1%. The consumer defensive sector accounts for 5.6%, while basic materials and real estate hold 2.4% and 2.5%, respectively. Lastly, utilities make up 2.1% of the portfolio.
FQAL has a similar sector allocation compared to the Russell 1000 index, as there are only small discrepancies with this index, such as slightly higher allocations in the technology sector (+0.5%), energy (+0.4%), and healthcare (+0.3%), and underweight exposure to consumer cyclical (-0.6%), communication services (-0.7%), and utilities (-0.2%).
Morningstar, consolidated by the author
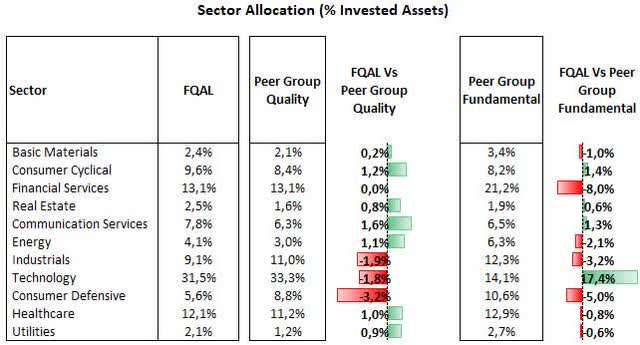
The average sector allocation of the peer group of quality ETFs is still generally close to the Russell 1000 index, but there are slight divergencies that give FQAL overweight allocations mostly in communication services, consumer cyclical and energy sectors, and lower exposure to consumer defense, industrials, and technology. In comparison with the peer group of ETFs with a fundamental approach, FQAL is significantly overweight in technology (+17.4%), while underweight in financial services (-8.0%) and consumer defensive (-5.0%). This reflects a common tendency in fundamentally driven ETFs toward more value sectors, such as energy, and away from high-multiples technology names.
Morningstar, consolidated by the author
The Fidelity U.S. Quality Factor Index’s focus on ROE and free cash flow has indeed boosted profitability measures for FQAL’s portfolio, not only for these two metrics, but also EBITDA and net income margins by nearly three percentage points compared to the Russell index, according to my estimations. Additionally, FQAL exhibits slightly higher growth measures than the benchmark. Core contributions for these higher financial measures come from FQAL’s overweight allocation to names like NVIDIA, Broadcom, Visa and Mastercard, and also underweight exposure to UnitedHealth, Tesla and Amazon, companies that exhibit lower margins than the Russell index on average.
On the flip side, FQAL’s price/earnings ratio is marginally higher compared to the Russell 1000 index, as the impact of the overweight allocation to names like Nvidia and Eli Lilly is offset by FQAL’s lack of exposure to TSLA and Amazon. Meanwhile, the price/sales ratio is substantially above the benchmark, driven mostly by Nvidia’s price/sales ratio of 36x, but also due to overweight allocation to Eli Lilly and Broadcom.
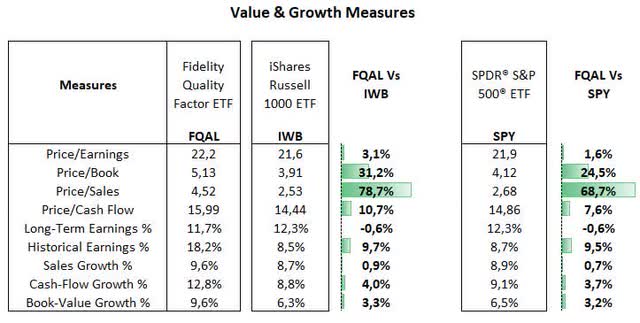
Morningstar, consolidated by the author
While FQAL’s valuation and growth metrics are generally similar to the peer group of quality ETFs, a comparison with fundamental ETFs shows FQAL with much higher valuation multiples, driven by the fundamental group’s underweight exposure to the technology sector and higher allocation to the low-multiples financial services sector.
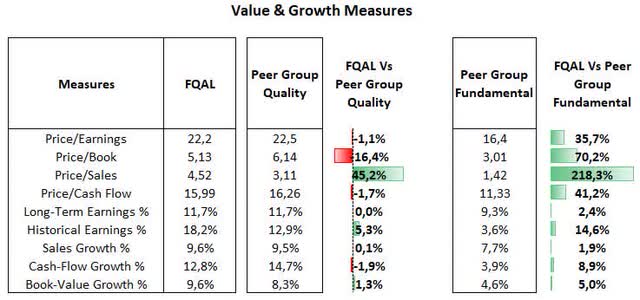
Morningstar, consolidated by the author
Not Compelling Performance
While FQAL’s approach toward higher quality companies has delivered positive returns in absolute terms, the fund has consistently underperformed benchmarks and the peer group of quality ETFs. In fact, FQAL’s performance has been only on par with the peer group of fundamental ETFs, with outperformance only in the past 12 months.
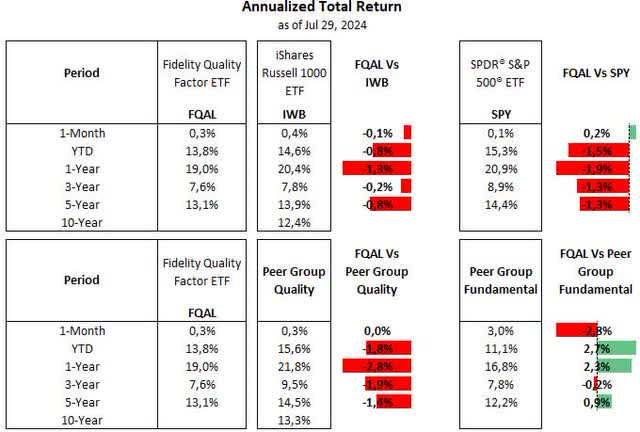
Morningstar, consolidated by the author
Meanwhile, FQAL’s volatility measures, such as beta and standard deviation, have been similar to the peer group of quality ETFs, but higher than those of the fundamental peer group. This apparent disconnect between returns and volatility leads to FQAL’s risk-adjusted returns readings being lower than those of both peer groups. The only positive aspect here is that the Russell 1000 index’s Sharpe ratio is not as good as well, given the higher beta and standard deviation seen in this index.
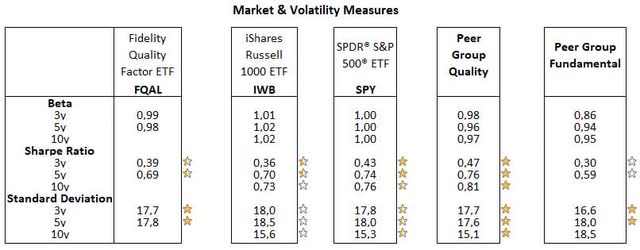
Morningstar, consolidated by the author
Thus, although we can say that FQAL’s risk-adjusted returns are in line with the benchmark, the reality is that FQAL has delivered sub-par performance over time, lagging both peer groups and the broader market.
That said, while the quality approach offered by this fund seems appealing on the surface, as ROE and free cash flow are arguably measures that reflect a company’s profitability, the overall result is a fund that has delivered total returns closer to a value-oriented fund, while showing higher volatility and valuation metrics than those funds on average.
In conclusion, investors looking to outperform the broader market with a high-quality portfolio may find better opportunities elsewhere. The peer group of quality ETFs used in the analysis is a good starting point, given its compounded returns compared to the Rusell 1000 and even the S&P 500 index.
Read the full article here


