

Dear Investors,
The Headwaters Capital Management, LLC (“Headwaters Capital,” “Headwaters,” or the “Firm”) portfolio returned +9.0% (+8.8% net) during Q3 2024 compared to a +9.2% return for the Russell Mid Cap Index over the same period. A brief discussion of the performance and trading activity during the quarter is presented below.
Headwaters Capital Performance
|
Q1 24 |
Q2 ’24 |
Q3 ’24 |
YTD (9/30/24) |
LTM (9/30/24) |
Cumulative Since Inception (1/4/2021) |
|
Headwaters Capital (Gross) 10.6% |
1.3% |
9.0% |
22.0% |
44.1% |
49.8% |
|
Headwaters Capital (Net) 10.4% |
1.1% |
8.8% |
21.4% |
42.1% |
44.8% |
|
Russell Mid Cap Index 8.6% |
-3.4% |
9.2% |
14.6% |
29.3% |
36.2% |
|
*Performance for the Headwaters Capital portfolio has been calculated by Liccar Fund Services from 1/4/2021-12/31/2023. **Performance for the Headwaters Capital portfolio has been calculated by Longs Peak Advisory Services from 1/1/2024- 9/30/2024. The composite performance (“portfolio” or “strategy”) is calculated using the return of a representative portfolio invested in accordance with Headwaters Capital’s fully discretionary accounts under management opened and funded prior to January 1, 2021. The performance data was calculated on a total return basis, including reinvestments of dividends and interest, accrued income, and realized and unrealized gains or losses. The returns also reflect a deduction of advisory fees, commissions charged on transactions, and fees for related services. For further information about the total portfolio’s performance, please contact Headwaters at the email address listed. |
Performance Discussion – Q3 2024
If you squint at the chart below, you can finally see slight outperformance by small caps (Russell 2000 + 9.2%) when compared to large caps (S&P 500 +5.8%) during Q3. The HCM portfolio performed in-line with the benchmark Russell Mid Cap index during Q3 following three consecutive quarters of strong outperformance.
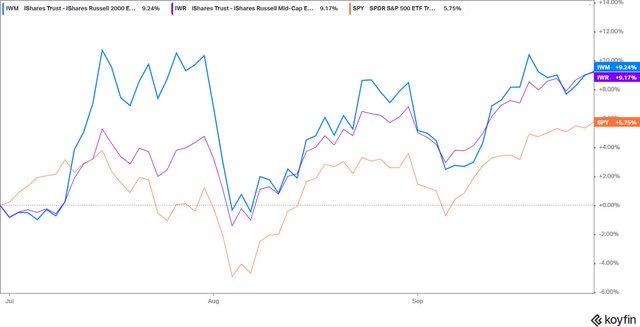
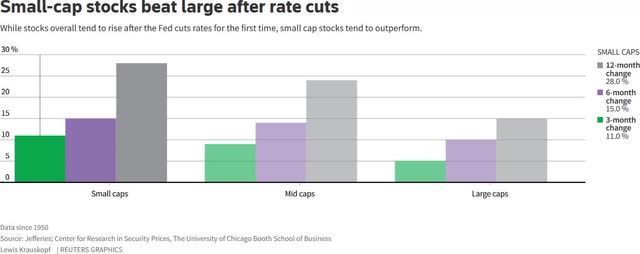
As discussed in previous communications, interest rate cuts have historically acted as a catalyst for small cap outperformance. This cycle appears to have parallels to history as small caps benefitted in Q3 with the Fed embarking on the long-awaited easing cycle with a 50bps rate cut in September. As can be seen in the chart below, this performance is consistent with initial small cap relative outperformance around previous rate cuts and, should history repeat, could signal further outperformance over the next 9 months.
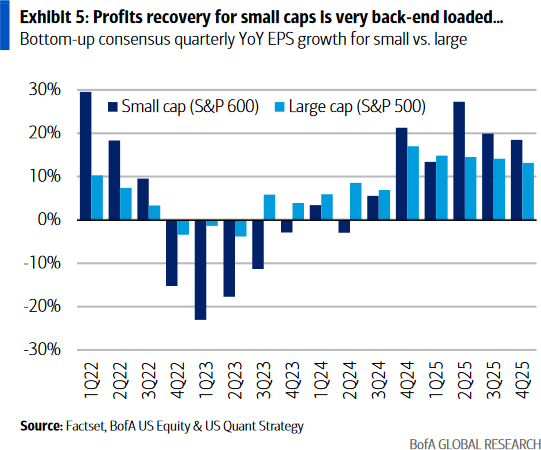
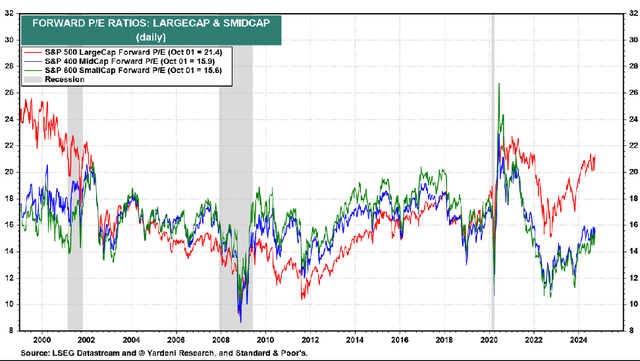
The outlook for faster earnings growth in 2025 combined with cheap valuations (both absolute and relative to large caps), remain the fundamental factors underpinning the opportunity for small cap outperformance. As a result, all the ingredients remain in place for ongoing small cap outperformance.
Q3 ’24 Portfolio Review:
Top Contributors: Fair Isaac Corporation (FICO) +31% and Climb Global (CLMB) +59%: FICO was the largest contributor to performance during Q3 given the size of the position in the portfolio. FICO’s stock performed well during the quarter as declining mortgage rates stimulated both refinance and purchase mortgage volumes.
CLMB was the second largest contributor to performance due to Q2 results where the company posted strong growth underpinned by ongoing demand for the distributor’s cybersecurity software products. CLMB also announced an accretive acquisition during the quarter, which drove positive earnings revisions. In addition to the strong operating performance, CLMB benefitted from multiple expansion when its closest competitor, Extreme Networks, was acquired by private equity at a multiple significantly above where CLMB was trading. The potential for capital deployment and multiple expansion was discussed in detail as part of the original thesis.
Top Detractor: Medpace (MEDP) -19%. Medpace declined during the quarter as bookings growth decelerated and concern around increasing clinical trial cancellations accelerated during the quarter. The reality is that Medpace’s clinical trial business exhibits cyclicality tied to the biotech funding environment, but these cycles occur within a secular growth opportunity. While biotech funding accelerated in Q1 ’24, growth since then has been more modest. Stepping back from the near-term noise, Medpace is still well positioned to capitalize on the trend of increased drug development by smaller biotechs and their reliance on contract research organizations (CRO’s) to perform clinical trial work. With only 5% market share, Medpace has ample room to continue gaining share given their position as the leading biotech CRO. Additionally, MEDP has proven to be a prudent capital allocator using cyclical downturns as an opportunity to aggressively repurchase shares. While MEDP’s stock has appreciated by +135% during HCM’s ownership, the stock experienced a -45% decline in 2022 when similar biotech funding fears emerged. Due to the cash balance that the company retained during that period and ongoing free cash flow, MEDP took advantage of the share price weakness by repurchasing 16% of shares outstanding. MEDP is in a similar position today with ~$700mm of cash on hand and is projected to generate an additional $500mm of FCF next year. Simply by deploying cash on hand, MEDP could repurchase 10% of shares outstanding over the next year. I would expect the company to be an aggressive repurchaser of shares if clinical trial weakness persists, which will lead to higher earnings per share power for the company over the long term.
As a side note, this is good example of why I push back on the idea that all volatility is bad. While I could try to trade around the biotech funding cycles that are nearly impossible to consistently predict (and this would have tax implications for investors), it’s easier to be a long-term owner of this business given that I’m comfortable that the per share earnings power of the company continues to increase despite short-term cycles. In this case, volatility actually works in our favor given that the company has been an excellent steward of capital by repurchasing shares when the stock is cheap. While long-term owners of this business have to stomach short term volatility in the stock, it’s worth it in order to capitalize on the ongoing per share earnings growth for the company, which will ultimately drive long-term share price appreciation.
Trading Activity
Buys: Altus Group (OTCPK:ASGTF)
Sells: National Vision (EYE): National Vision was sold during the quarter due to ongoing operational issues, the small position size and better investment opportunities elsewhere.
Altus Group (OTCPK:ASGTF) Class A Trophy Asset Trading at Depressed Valuation: Tenant Improvements Drive Margin Expansion and Valuation Re-Rating
Summary Thesis
- Industry Standard Property Valuation Software for Complex Commercial Real Estate Assets with an Expanding Data and Analytics Offering
- Sale of Cyclical and Low Multiple Property Tax Business Will Lead to Management and Investor Focus on Trophy Software Asset
- Margin Improvement Opportunity in the Analytics Business from Self-Help and Cyclical Valuation Services Recovery
- Significant Cash Balance Post Property Tax Sale Funds Share Repurchases and/or M&A
- Aligned Management Team and Board
Business Overview – Altus Analytics
Altus Group (“Altus,” “Company,” “AIF”), listed in Toronto under the ticker AIF, is a collection of commercial real estate software and services businesses assembled through a series of acquisitions dating back to 2011 when the company converted from an income trust to a corporation. The core software asset, ARGUS Enterprise (“AE”) is the leading global solution for CRE valuation and portfolio management and is widely recognized as the industry standard for complex property valuations. The ARGUS valuation model is based on a discounted cash flow (“DCF”) methodology and its capabilities range from property and portfolio valuation analysis to financial modelling, scenario analysis, and reporting. With over 30 years of industry presence, AE has robust data on over one million commercial properties and the AE valuation methodology is taught in over 200 academic institutions worldwide. Beyond the AE valuation model, ARGUS is a comprehensive CRE portfolio management platform that helps clients streamline and optimize various aspects of investment analysis, valuation and property management. ARGUS is used by investors, brokers, and other real estate capital markets professionals who own, transact or monitor commercial real estate properties. Similar to other software companies, AE has undergone a transition from a license to SaaS model and subscriptions are sold on a per user basis. Recent investments in the software platform are designed to leverage the tremendous data inside the ARGUS platform in order to deliver increased functionality via enhanced analytics, modeling, benchmarking and forecasting.
Altus also has a Valuation Management Services (“VMS”) business where key clients include many of the largest real estate funds. Investors in these funds require independent verification of property level values and Altus’ VMS segment prepares valuation reports for assets in these funds on a regular cadence, typically quarterly or annually. Altus outsources the retrieval of property level data to local valuation experts and then consolidates this information (using AE models) into a valuation report for asset owners. Argus charges for these services on a per asset basis and, as a result, revenues are correlated to fundraising and capital deployment, both of which have been depressed over the last two years.
Property Tax Sale – “Tenant Improvement” Catalyst for the Business and Stock
The investment opportunity for AIF revolves around the pending sale of its legacy property tax business as it will focus both management and investors on the crown jewel Analytics business, which is currently under-appreciated by the market due to multiple overhangs (obscured by Property Tax, cyclical pressures, small cap listed in Canada). Altus’ Property Tax business manages property taxes and appeals for clients, primarily in Canada and the UK and accounted for 39% of segment level EBITDA for Altus in 2023. This was historically viewed as a low multiple business given cyclicality and the opaqueness associated with the contingency fees that comprised the majority of this segment’s revenues. In June of 2024, Altus announced a sale of this business that is expected to close in 1H 2025.
The sale of this business should be a catalyst for AIF’s stock for a number of reasons. First, management will be able to focus its attention on the Analytics business, which should give investors’ confidence that the revenue and margin targets for this segment are achievable. Second, proceeds from the sale of this business will leave the company with CAD$400MM of net cash and CAD$700mm of capital available for M&A/share repurchases (assumes a 2.0x gross leverage ratio based on management’s comments). Finally, the streamlined business will be significantly more attractive to investors as the crown jewel Analytics business will no longer be obscured by the property tax business. As management executes on the growth and margin targets for the Analytics segment, this should result in a higher multiple as investors recognize the similarities that this business has to other vertical market software and data provider peers (see valuation discussion below). A potential US listing for the stock could also be supportive of a multiple re-rating as this would enable access to a larger pool of investors.
Financials: Revenue
The last couple of years have been a difficult environment for Altus. Commercial real estate transaction volumes declined in 2023 and 2024 as higher interest rates created wide bid-ask spreads, resulting in a frozen transaction market. As the data below shows, real estate investment volumes declined significantly in both 2023 and 2024 are running ~40% below pre-COVID levels.
Source: JLL Q2 2024 Investor Presentation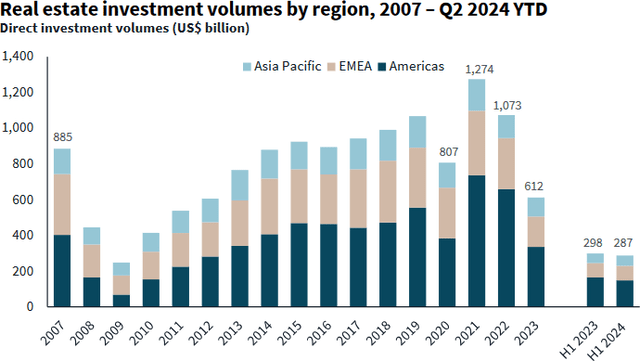
Looking at function (a key asset class for AIF) more specifically, transaction volumes in 2023 were ~60% below pre-COVID levels as the combination of declining occupancy and higher interest rates created even more pressure on this property type. However, even in the absence of transactions, AE’s software remains critical for day-to-day activities as CRE asset owners are still required to value properties on a regular schedule for investor reporting purposes. Despite the significant headwinds faced by AIF’s end markets, recurring revenues have proven resilient and have grown in both 2023 and YTD 2024. Unsurprisingly, transactional related revenues are currently running ~30% below 2022 levels, although this only accounts for 8% of the segment’s revenues. Looking forward, it’s hard to imagine transaction volumes declining significantly from current levels and it’s likely that the market will experience a cyclical rebound in volumes over the next few years. CBRE, a global real estate services and advisory company, noted on their Q2 2024 call that they believe their advisory business is near an inflection point:
“The bid-ask spreads are narrower than they were before, except maybe in office. Our investment sales brokers and mortgage brokers are more active and have stronger pipelines than they did before. Our work with office tenants, where we measure through all kinds of different mechanisms and surveys, sentiment has gotten better. So we have this anecdotal evidence from the second quarter starting and then the third quarter and then we have more technical evidence that causes us to think that we may well have gone through an inflection point on transactions that’s going to impact leasing, it’s going to impact sales”
Increasing transaction activity will be beneficial to AIF as this will stimulate demand for Argus software subscriptions and will drive a rebound in Altus’ transactional valuation services. Additionally, increased transaction activity will enable investment firms to deploy the significant dry powder that has accumulated over the last few years.
Source: JLL Q2 2024 Investor Presentation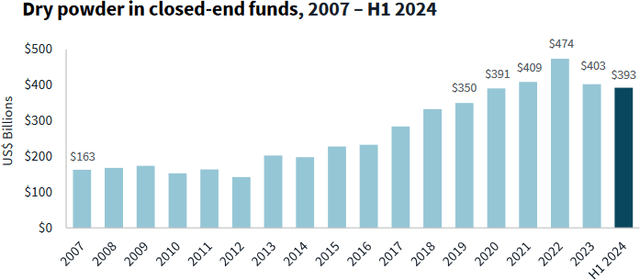
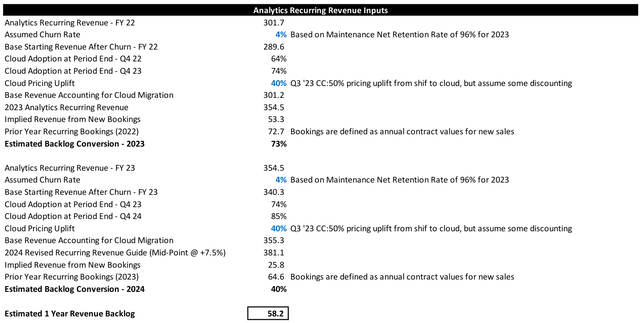
As investors deploy these funds into acquiring more assets, AIF’s valuation management segment will benefit as it capitalizes on the backlog of assets that it has booked for valuation services over the last few years. This point is important to understand and is not well understood given that Altus only reports total bookings and does not disclose bookings specifically for VMS or ARGUS. Altus records a VMS booking once a fund engages Altus for valuation services but does not book revenue until the fund acquires assets and uses Altus to value the asset. As an example, let’s say a fund raised $10B in 2022, but didn’t deploy those funds in 2023 due to a frozen transaction market. Altus would report bookings associated with that fund engaging VMS for future valuation services but would not recognize any revenue from this booking given that no valuation services were provided. Instead, Altus retains a backlog of future VMS revenue that will be recognized once those funds are deployed. Based on details that Altus has disclosed, we can make a rough estimate of backlog conversion over the last two years and an approximation of revenue backlog that Altus should recognize once the transaction market thaws (see appendix for details). While it’s likely that some of this backlog won’t be recognized for various reasons, I estimate that Altus currently has ~CAD$58mm of VMS backlog that has yet to be recognized, which positions the company well to meet the implied CAD$65mm of recurring revenue growth that the Company is targeting for 2026.
Source: Altus Group Investor Presentation (August 2024)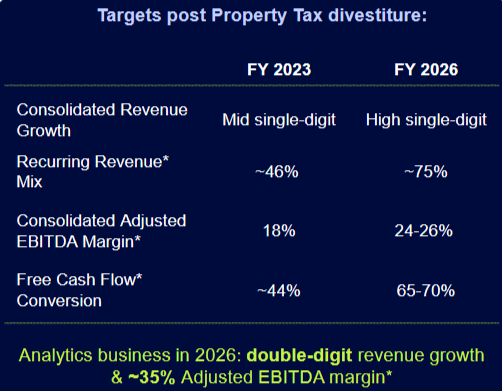
Given that the conversion from license to SaaS is nearly complete in 2024 (85% of customers have transitioned) and the benefit from this pricing uplift has largely run its course, the VMS backlog is important to underwriting 2026 revenue targets. While Altus will continue to recognize some pricing uplift from enhanced functionality to AE, the end of promotional discounts related to SaaS conversions, and an acceleration in new SaaS subscriptions from improving CRE transaction volumes, I don’t believe the AE growth alone is sufficient to meeting 2026 targets.
Converting the VMS backlog to revenue, which should occur over the next couple of years, will be critical to meeting 2026 targets.
Stepping back from the specific details of the revenue outlook, the key theme underpinning this growth is the institutionalization of commercial real estate, a trend that has been ongoing for nearly a decade. While institutional allocations have flat lined over the last two years due to elevated interest rates and the frozen transaction market, steady increases are expected longer-term.
Source: Hodes Weill & Associates: 2023 Institutional Real Estate Allocations Monitor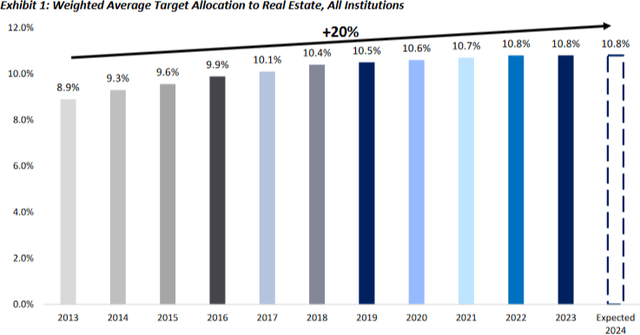
As investors continue allocating more money to commercial real estate funds, this provides a long-term tailwind for AIF’s revenue in the form of a growing software user base and an increasing number of assets covered by VMS. AIF has an opportunity to supplement this core revenue growth with enhanced data and analytics offerings that provide up-sell and cross-sell opportunities. As the trusted industry leader in real estate valuation data and with decades of data and experience, Altus is uniquely positioned to deliver this enhanced functionality to the market.
Financials – Margins
Accelerating revenue growth is only part of the 2026 earnings growth story for AIF, management is also targeting 700bps of margin improvement in its Analytics business. Like other software companies that have converted from a license to SaaS model, the transition initiated in 2018 depressed margins for the Analytics business due to a combination of increased expenses from significant sales and R&D investments while simultaneously losing high margin license sales. Now that this transition is largely complete, Altus has bridged the revenue gap and can improve margins through both operating leverage and cost reductions as they sunset the final on-premise licenses over the next two years.
Analytics margins have also seen pressure over the last three years as the Company digested lower margin software acquisitions and spent heavily to integrate these acquisitions (note this was all done under the previous management team). Altus also implemented a new ERP system over the last two years that led to elevated expenses. Going forward, Altus is focused on improving profitability through a disciplined expense management focus that includes moving more back-office resources offshore and reducing many duplicative costs that have been incurred via M&A.
In addition to margin improvements in the software business, VMS margins also have the potential for significant expansion. Like the revenue growth algorithm, VMS appears to be the misunderstood margin lever for AIF. As CEO Jim Hannon discussed during the Q3 2023 Earnings Call:
“The VMS business, the incremental contribution margin… is it looks and have similar profile to data analytics margins. So, these are very tech-heavy expert service businesses, which allow for significantly higher margins than other types of services business because of the amount of leverage we get out of the tech.”
As outlined above, AIF has a large backlog of VMS revs that will eventually convert to revenue, leading to high incremental margins for the business. While 700bps of margin improvement in two years appears aggressive, Altus has numerous levers that should allow the company to meet these targets.
Sale Proceeds and Capital Allocation
Net proceeds from the sale of Altus’ property tax business will leave AIF with a net cash balance of ~CAD$400mm. Given a stated target of 2.0x gross leverage, Altus will have excess capital of CAD$700mm that can be used for a combination of share repurchases and M&A. At the current share price, Altus could reduce its share count by ~30%. I would expect a majority of the proceeds to be deployed toward M&A in an effort to continue building a dominant CRE software, data and services platform, but it’s useful to put the size of the cash balance into perspective. It’s difficult to estimate the financial impact from M&A, but the sizeable cash balance gives AIF the opportunity to pursue strategic data and analytics offerings that could complement its existing ARGUS platform.
Management & Board
CEO Jim Hannon was originally hired as the Chief Commercial Officer for Analytics in 2020 and was promoted to CEO in 2022. Mr. Hannon was not the CEO when Altus embarked on an M&A spending spree in 2021. While Altus acquired strong strategic assets for the Analytics business, the company significantly overpaid for these assets as software valuations reached bubble territory in 2021. Early strategic actions including a more restrained M&A posture, focus on debt repayment and the announcement of the Property Tax divestiture all indicate that Mr. Hannon is more focused on creating shareholder value than prior management teams.
Mr. Hannon is also well aligned with shareholders as he currently holds various options with expiries ranging from December 2025 through March 2028 at strike prices ranging from CAD$49-59. At the current share price of CAD$53, these options have almost no value. At a CAD$75 share price, these options are worth CAD$5.6mm providing Mr. Hannon ample incentive to drive share price appreciation prior to expiry. Additionally, Mr. Hannon owns another CAD$5.0mm of shares through vested performance stock units and long-term restricted shares. Mr. Hannon can also earn performance stock units based on relative total shareholder return over a three-year period. Given the poor stock price performance in 2023, Mr. Hannon is incentivized to see strong share price performance over the next few years.
In addition to Mr. Hannon’s focus on driving operational improvement and compensation alignment, shareholders also have support from Will Brennan, who was recently appointed to the Board. Mr. Brennan, as portfolio manager of Long Path Partners, holds a 4% ownership stake in AIF and has been a long-term shareholder. Mr. Brennan will be a valuable voice in the boardroom.
Valuation: Attractive Acquisition Target – Justification for Premium Multiple
The financial analysis discussed above aims to demonstrate comfort with management’s 2026 financial targets. In estimating the value for AIF, I have assumed management achieves the low end of their 2026 targets (8% revenue growth, 24% EBITDA margins), which results in 2026 EBITDA of CAD$147mm. However, this is only part of the puzzle as the streamlined company should command a premium valuation multiple relative to history. Following the sale of the Property Tax business, AIF will have financial characteristics similar to other high-quality software and data providers. These businesses generally trade at multiples of ~20x EBITDA in the public market. As a standalone business, AIF should trade for at least CAD$73, which represents 38% upside from the current price.
AIF Stand-Alone Value
|
2026 Organic EBITDA |
147 |
|
Stand-Alone EBITDA Multiple |
20.0x |
|
EV |
2,945 |
|
Less: Debt/(Cash) |
(494) |
|
Equity Value |
3,440 |
|
Shares O/S |
47.0 |
|
Stand-Alone Value |
$ 73.19 |
|
Current Price |
$ 53.00 |
|
Upside/(Dowside) |
38% |
However, the 20x EBITDA multiple should be a floor valuation for AIF given that the company will be an attractive acquisition target for a wide range of buyers following the sale of Property Tax. As the table below illustrates, there are numerous strategic buyers across different industries that have previously shown interest in real estate technology and data providers.
Real Estate Technology, Data, & Analytics M&A Comp Table
|
Date |
Target |
Acquirer |
Purchase Price ($’s) |
Revenue ($’s) |
EBITDA |
EBITDA Margin |
Revenue Growth |
EBITDA Multiple |
|
8/2/2021 |
Real Capital Analytics |
MSCI |
950.0 |
70.0 |
19.6 |
28% |
Double Digit |
48.5x |
|
10/1/2019 |
STR Group |
CSGP |
425.0 |
64.0 |
16.0 |
25% |
10% |
26.6x |
|
8/30/2018 |
REIS |
Moody’s |
278.0 |
48.2 |
12.8 |
27% |
Flat/Declining |
21.7x |
Costar Group (CSGP) has been the most active acquirer of real estate data and analytics assets over the last decade and acquired STR Group in 2019 for 26.5x EBITDA. Per CSGP’s 2019 press release announcing the acquisition:
“STR has grown its data assets, product offerings and geographic reach to become the gold standard in the global hospitality industry for premium data analytics, performance benchmarking and market insights.” – CSGP Press Release (10-1-2019)
STR represents a good comp for the streamlined AIF given similar business models and financial profiles. STR was the leader in data and analytics for the hospitality industry while Altus occupies the same position for office and other complex real estate properties. The margins and revenue growth profiles for each business are also remarkably similar.
Thinking about Altus’ reach more broadly, the Company’s deep connections with institutional commercial real estate clients are arguably as valuable as its property data and analytics offerings. Moody’s noted the appeal of the data and relationships as part of its rationale for acquiring REIS in 2018.
“Reis has built over the last nearly 40 years… a very unique dataset, a very detailed information on essentially every commercial property in the United States. And that’s a — we’ve always talked about unique datasets as being very powerful assets that when, in the context of Moody’s Analytics and bringing our other data and our other analytical capabilities together with those unique datasets, we think there are some very rich opportunities for us to commercialize and monetize those assets… I mean, they’ve got nearly 1,000 customers. And over half of that customer base is a customer base that we don’t have. So there’s a very interesting opportunity for us to extend the range of capabilities that Reis has provided, which has essentially been to deliver the data we think we’re going to be able to offer a lot on top of that. So I think Reis accelerates our position in commercial real estate quite substantially.” Moody’s Corporation: Barclays Financial Services Conference (9-14-18)
MSCI’s slide from its acquisition of Real Capital Analytics (“RCA”) in 2021 also highlighted the value of this client base as part of their investment rationale.
Source: MSCI Acquisition of Real Capital Analytics Presentation (8-2-21)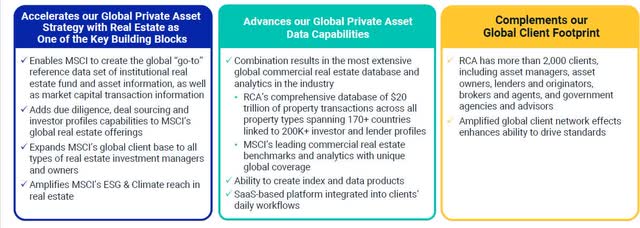
The strategic transactions above provide a range of valuations that could be relevant should Altus engage in a sale. For illustrative purposes, the M&A analysis below uses the CSGP/STR comp to show potential upside if Altus does attract M&A interest. Given AIF’s scale, large cash balance and diverse acquisition interest, acquisition multiples could easily exceed this example.
AIF M&A Value
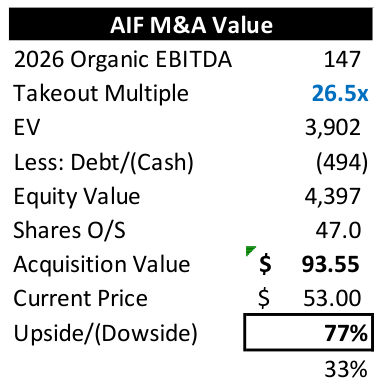
In addition to strategic interest, AIF could also represent an attractive target for private equity given the cash balance, cash flow profile and stable growth outlook. PE has been active in the space as Green Street Advisors, a similar data and analytics real estate services company, has transacted multiple times over the last decade (Golden Gate Capital, Welsh Carson Anderson and Stowe, TA Associates). As Chris Hooper at WCAS noted in 2019:
“Green Street sits at the intersection of our sector focuses in Data & Analytics and PropTech, where we look to invest in businesses that are providing data and software to drive more informed decision-making, investing, and asset management for the commercial real estate industry. We believe this market has historically been opaque and slow to embrace technology relative to other industries, and thus is ripe for disruption.”
Replace “Green Street” with “Altus Group” in the quote above and you have a similar company that could easily attract private equity interest.
In considering the potential future valuation for AIF, it is also worth noting that the Company traded at a 20x EBITDA multiple prior to COVID when property tax EBITDA was double that of the Analytics business. As evidenced by the sale of the property tax business for only 10x EBITDA, this implied a significantly higher valuation for the Analytics business. As the market grows more comfortable with a simplified Altus, the CRE market recovers, and Altus adds additional capabilities via M&A, it’s not unrealistic to think that Altus could trade well above a 20x EBITDA multiple.
Summary Thesis
Altus has a unique and irreplaceable asset in its ARGUS software platform. AE is the industry standard valuation tool that is deeply embedded in the commercial real estate ecosystem, specifically for complex properties such as office. Embedded within ARGUS is a rich set of data which Altus is increasingly monetizing through enhanced software functionality and analytics. Industry tailwinds from the institutionalization of commercial real estate are supportive of steady growth for both the ARGUS platform as well as VMS services while increased data monetization efforts provide additional revenue tailwinds. Near-term, an inflection in transaction volumes as industry bid-ask spreads narrow will provide a catalyst for revenue growth for VMS where revenue is earned on a per asset basis. Completion of recent investments to transition from a license to SaaS model along with management focus on expense discipline should enable strong operating leverage which will produce significant margin improvement going forward. Management’s financial targets for 2026 appear reasonable given ongoing demand for AE and a strong VMS backlog that is set to unlock once transaction volumes recover.
The market currently underappreciates the value of the core Analytics business given that this segment has been obscured by the relative size of the Property Tax segment, the VMS business is experiencing cyclical headwinds and that AIF is a small cap stock listed in Canada. The sale of the Property Tax business, which should coincide with a cyclical rebound in VMS growth, is the catalyst for increased investor appreciation for the quality of Altus’ Analytics business. This is an asset that should trade for at least 20x EBITDA as a stand-alone entity. However, the niche focus of the business would make it an attractive acquisition candidate for a diverse set of strategic and financial buyers. Acquisition multiples for an asset like Altus have ranged from 26x-40x EBITDA, suggesting significant upside potential.
Appendix – Backlog Estimate
Analytics Recurring Revenue Inputs
As always, if you have any questions about the portfolio or the market, please do not hesitate to contact me.
Christopher Godfrey
|
Important Disclosure This letter is for informational purposes and shall not constitute an offer to sell, or a solicitation to buy, any security, product, or service from Headwaters Capital. The opinions expressed herein represent the current views of Headwaters at the time of preparation and are provided for limited purposes, are not definitive investment advice, and should not be relied on as such. The information presented in this letter has been developed internally and/or obtained from sources believed to be reliable; however, Headwaters Capital does not guarantee the accuracy, adequacy, or completeness of such information. Predictions, opinions, and other information contained in this letter are subject to change continually and without notice of any kind and may no longer be true after the date indicated. Any forward-looking statements speak only as of the date they are made in this letter, and the Firm assumes no duty to the reader to update forward-looking statements or any other information provided in this letter. Forward-looking statements are subject to numerous assumptions, risks, and uncertainties, which change over time. Actual results could differ materially from those anticipated in forward-looking statements. In particular, target returns are based on the Firm’s historical data regarding asset class and strategy. There is no guarantee that targeted returns will be realized or achieved or that an investment strategy will be successful. Individuals should keep in mind that the securities markets are volatile and unpredictable. Therefore, investing in securities or other investment products involve a high degree of risk. There are no guarantees that the historical performance of an investment, portfolio, investment product, fund, or asset class will have a direct correlation with its future performance, and past performance does not guarantee future results. The composite performance (“portfolio” or “strategy”) is calculated using the return of a representative portfolio invested in accordance with Headwaters Capital’s fully discretionary accounts under management opened and funded prior to January 1, 2021. The performance data was calculated on a total return basis, including reinvestments of dividends and interest, accrued income, and realized and unrealized gains or losses. The returns also reflect a deduction of advisory fees, commissions charged on transactions, and fees for related services. For further information about the total portfolio’s performance, please contact Headwaters at www.headwaterscapmgmt.com or via phone at (404) 285-0829 Investing in small- and mid-size companies can involve risks such as less publicly available information than larger companies, volatility, and less liquidity. Investing in a more limited number of issuers and sectors can be subject to greater market fluctuation. Portfolios that concentrate investments in a certain sector may be subject to greater risk than portfolios that invest more broadly, as companies in that sector may share common characteristics and may react similarly to market developments or other factors affecting their values. Headwaters Capital is a registered investment adviser doing business in Texas and Georgia. Registration with any state regulatory agency does not imply a certain level of skill or training. For additional information about Headwaters Capital, including its services and fees, please review the firm’s disclosure statement as set forth in the Firm’s Form ADV and is available at no charge at IAPD – Investment Adviser Public Disclosure – Homepage. |
Original Post
Editor’s Note: The summary bullets for this article were chosen by Seeking Alpha editors.
Editor’s Note: This article discusses one or more securities that do not trade on a major U.S. exchange. Please be aware of the risks associated with these stocks.
Read the full article here