By Jeff Spiegel, Mark Orans
U.S. investors in international markets may tend to focus broad benchmarks such as the MSCI Emerging Markets Index and as a result, may miss exciting opportunities to target specific countries. Local market trends and global forces leads us to believe that Japan, Mexico and India as three such opportunities. While each of these three countries has idiosyncratic reasons for growth, they are all benefitting from a global shift towards diversified supply chains.
Below, we dive deeper into each opportunity and highlight what is behind the growing investor interest.
Japan’s Comeback
Japan ETFs have seen major inflows year to date, with over $5.7 billion through August.1 If this pace continues, 2023 could be the best year for Japanese ETF inflows in a decade.2 In early July, the Nikkei index reached an impressive milestone, surging to its highest level in 33 years by surpassing 33,700 points.3 The MSCI Japan Index has also performed well, recording 13.6% total return year to date through August.4 Interest in Japan has been driven by the following:
-
Equity market reforms: The Tokyo Stock Exchange recently announced they would require companies with a price-to-book value below one to draw up capital improvement plans, with a threat of delisting if improvements are not made.5 Price to book value is a financial ratio that can provide insight into the relationship between a company’s stock price and its book value per share. A low price to book ratio might reflect concerns about the company’s profitability or future growth prospects.
- Buffett’s bet: Famed investor and CEO of Berkshire Hathaway, Warren Buffett, visited Japan in early April 2023 to announce that he was raising his firm’s stakes in five publicly traded Japanese conglomerates. In the five days following Buffet’s announcement, overseas investors poured $7.8 billion into Japanese equities.6
- High-tech leadership: As the world actively seeks to diversify its supply chains, Japan finds itself in a favorable position to reap the benefits of this global shift. The BlackRock Investment Institute (BII) identifies geopolitical fragmentation and economic competition as a mega force reshaping the world. BII believes that industrial and protectionist policies could potentially stimulate increased investments in infrastructure and robotics.7 As global leaders in both industrial automation and semiconductor manufacturing equipment — key inputs to supply chain diversification — Japanese companies may see growing demand.
What’s next for Japan?
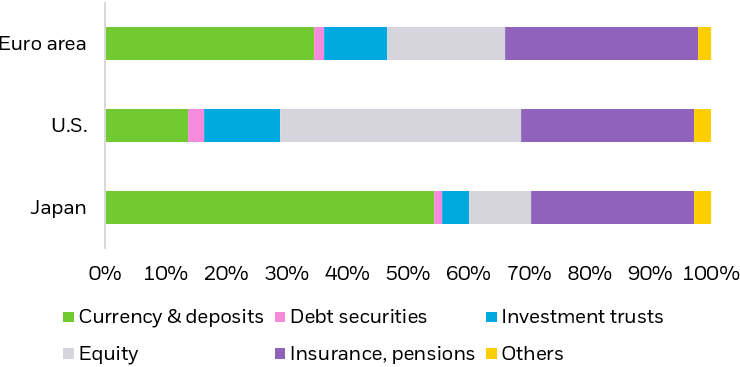
We note that while some central bank tightening should be expected, monetary policy should remain loose and supportive compared to most developed markets.8 Additionally, higher inflation may help move households with high cash allocations to get off the sidelines and invest into domestic equities. The average Japanese household holds just 10% of their assets in equities, compared to nearly 40% for the average U.S. household, leaving a long runway for growth (See Figure 1).
Composition of household assets across the Euro area, U.S. and Japan

Source: Bank of Japan, Goldman Sachs Research, as of 1 June 2023. BoJ data as of August 2022.
Chart description: Bar chart illustrating the distribution of household assets among people in the Euro area, U.S., and Japan, with a notable observation being that Japanese households exhibit the lowest proportion of assets invested in equities.
India Takes Center Stage
India ETFs have seen a tremendous surge in interest year to date, with nearly $2 billion of inflows through August.9 If this pace continues, just as with Japan, 2023 will be the best year for flows into India ETFs in over a decade.10 This surge in interest has been paralleled by strong performance; the MSCI India Small Cap Index, as an example, is up 25.9% through August, amongst the best performing single country indices in the world in 2023.11 Investor interested in India has been propelled by the following:
-
Economic growth: The Indian economy is now the world’s fifth largest, recently overtaking the United Kingdom. By the end of the decade, economists believe India will be the world’s third-largest economy, behind only the U.S and China.12 The Indian economy grew at a rate of 7.2% for the 2023 fiscal year (ended March 2023), and growth is expected to remain strong in the 2024 fiscal year, making India the fastest growing economy in the G20.13
- Manufacturing opportunities: As supply chains rewire and the world looks to find a gateway to growing South Asian markets, India is well-positioned to benefit. The Indian government has taken note and is looking to increase its attractiveness as a home for manufacturing. They have introduced production-linked incentives to encourage overseas manufacturers; the initiative drew $6.5 billion in investments during 2022.14
What’s next for India?
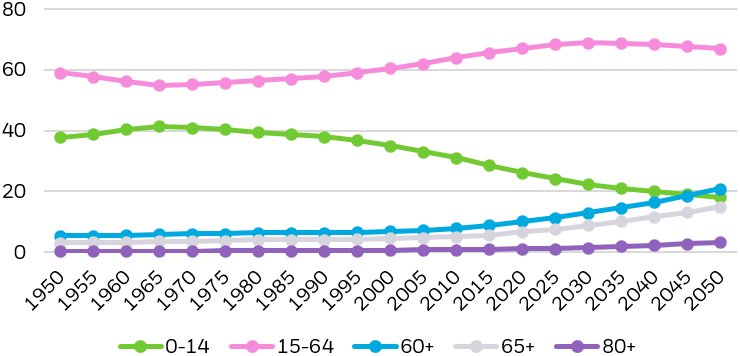
We believe that investors should pay close attention to India’s favorable demographic trends. One of the significant mega forces identified by BII is demographic divergence. This concept suggests that specific countries will experience either substantial challenges or advantages based on their demographics. In India, the demographic outlook is exceptionally positive, as it has recently become the world’s most populous nation, with a population exceeding 1.4 billion people.15 Notably, more than 970 million of these individuals fall within the prime working ages of 15-64, indicating a robust potential workforce.16
India’s substantial working-age population places the nation in a favorable position to reap the advantages of a ‘demographic dividend’. This term refers to the potential for accelerated economic growth brought on by a change in the structure of a country’s population, typically characterized by declining fertility and mortality rates. The Indian middle class has now grown to 432 million people,17 a formidable group of consumers who now have discretionary income. Companies are taking note, with Apple recently announcing the opening of its first physical stores in the country.18
Proportion of India’s total population by broad age group, 1950–2050

Source: Economic and Social Commission for Asia and the Pacific, India demographics data, accessed on 08/18/2023.
Chart description: Line chart visually tracing India’s shifting demographic landscape from 1950 to 2050, categorizing the population into distinct age groups. Notably, the age group spanning 15-64 years stands out as the largest segment of growth in the next few decades and shows why India has such potential to capitalize on a demographic dividend for future socioeconomic progress.
Mexico’s Supply Chain Advantage
Mexican equities have had the strongest year of all, with the MSCI Mexico IMI 25/50 Index up 27.4% through August.19 Flows into Mexico ETFs have followed, with nearly $300M over the same timeframe.20
When analyzing Mexican equities, we believe the key reason investors have grown more bullish is the country’s prime opportunity to benefit from the ongoing rewiring of globalization. Similar to Japan, we see Mexico benefitting from the mega force of geopolitical fragmentation and economic competition, as countries look to diversify supply chains. Mexico is appealing to investors for several reasons:
- Geographic proximity to U.S.: Nearshoring is a huge trend in supply chains today — relocating resources to a country that is close to the final consumer to ensure greater supply resiliency. As a result, many companies are moving supply chains to Mexico. Notably, Mexico’s transportation costs for shipping goods to the U.S. is a fraction of the costs compared to shipping goods from countries like China and Brazil, according to the Organization of Economic Co-operation and Development.21
- U.S.-Mexico-Canada free trade agreement (USMCA): Friendshoring, a trend related to nearshoring, seeks to drive resilience through reducing political uncertainty. The USMCA is an agreement that reduces tariffs between the U.S., Mexico, and Canada; it aims to bolster the regional supply chain. Amid ongoing global trade tensions, the USMCA provides comfort for firms who want to freely move goods into the U.S. market. According to a recent survey of foreign businesses in Mexico, the USMCA is among the top reasons they move their operations into the country.11
- Manufacturing base and labor force: Nearshoring and friendshoring work especially well for Mexico because of its well-established manufacturing base. Mexico’s manufacturing sector represents 18% of GDP, higher than other developing countries such as Brazil (11%), India (13%) and Argentina (15%).22 In addition, Mexico is typically amongst the top-ten countries in terms of engineering graduates per year, giving businesses an ample pool of human capital to drive innovation.11
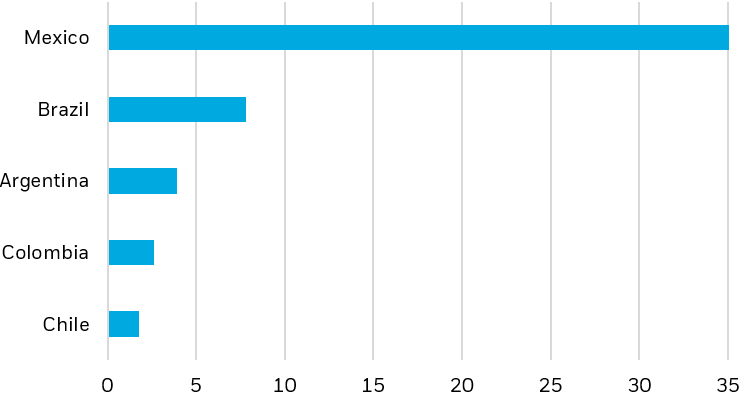
Total additional exports of goods forecast by country ($bn)

Source: Inter-American Development Bank (IDB). “Nearshoring can add annual $78 bn in exports from Latin America and Caribbean”, 06/07/2022.
Chart description: Bar chart displaying the total additional exports of goods forecasted for various countries in Latin America and the Caribbean. Mexico stands out with the highest total additional exports among all the countries in the region, indicating a significant forecasted increase in exports.
What’s next for Mexico?
Going forward, investors will be focused on the strength of the Mexican economy as well as whether legislative actions can help Mexico take advantage of the current moment. Mexico’s GDP growth is projected to slow from 2.3% in 2023 to 1.5% in 2024 as the post-pandemic rebound wears off. However, a resilient U.S. economy could lead Mexican growth to surprise to the upside, as the large majority of goods Mexico produces are for U.S. exports.13 Investors will also pay attention to actions of the Mexican government, which has elections coming up in 2024. Positive actions, such as the $1.5 billion pledged to modernize ports,23 as well as programs such as Immex, which attract foreign companies to import raw materials duty free,24 are bullish signals for investors.
Conclusion
ETFs may help investors access international investment opportunities — whether through individual sector ETFs or individual country ETFs within the broader developed and emerging markets. Thanks to support of both local trends and global mega forces, we think investors could stand to benefit from granular exposures to Japan, India and Mexico, both in the short and long-term.
© 2023 BlackRock, Inc. All rights reserved.
1 BlackRock Global Business Intelligence as of 8/31/2023. YTD Inflows based on 17 U.S.-listed Japan ETFs with 95% or more Japan country exposure through 8/31/2023.
2 BlackRock Global Business Intelligence, Bloomberg as of 8/31/23.
3 The Nikkei 225 Average Index NR closed at 33,753 on 7/3/2023, the highest level since March 1990. Data from Morningstar as of 8/31/2023. Index performance is for illustrative purposes only. Index performance does not reflect any management fees, transaction costs or expenses. Indexes are unmanaged and one cannot invest directly in an index. Past performance does not guarantee future results.
4 Morningstar as of 8/31/2023. Index performance is for illustrative purposes only. Index performance does not reflect any management fees, transaction costs or expenses. Indexes are unmanaged and one cannot invest directly in an index. Past performance does not guarantee future results.
5 CNBC, “Japan optimism has been fueled by ‘game-changing’ reforms and Warren Buffet: Here’s what you need to know”, 6/12/23.
6 CNBC, “What Warren Buffet is buying in Japan’s Berkshire Hathaway look-alikes,” 5/5/23.
7 BlackRock Investment Institute 2023 Mid-Year Outlook.
8 iShares Precision Insights: Japan, August 2023.
9 BlackRock Global Business Intelligence as of 8/31/2023. YTD Inflows based on 16 U.S.-listed India ETFs with 95% or more India country exposure through 8/31/2023.
10 Morningstar, as of 8/31/2023.
11 Morningstar, as of 8/31/2023.
12 S&P Global Market Intelligence, “Outlook for India’s economic growth and policy platforms”, 11/21/22.
13 S&P Global, “India’s Future: The Quest for High and Stable Growth”, 8/3/23.
14 Times of India, “India’s production incentive scheme draws $6.54 billion in investments”, 4/26/23.
15 Center for Strategic & International Studies, “What India becoming the world’s most populous country means”, 4/28/23.
16 Economic and Social Commission for Asia and the Pacific, India demographics data, accessed on 8/10/23.
17 Financial Times, “Gauging India’s middle-class opportunity”, 5/16/23.
18 CNN, “Apple commits to investing across India as Tim Cook opens second store,” 4/20/23.
19 Morningstar, as of August 2023.
20 BlackRock Global Business Intelligence as of 8/31/2023. YTD Inflows based on 3 U.S.-listed Mexico ETFs with 95% or more Mexico country exposure through 8/31/2023.
21 Bank of America, “Nearshoring in Mexico: A lifetime opportunity”, 10/25/22.
22 World Bank, “Manufacturing, value added (% of GDP), accessed on 8/10/23.
23 Elpasomatters.org, “As trade grows, U.S. and Mexico race to invest in ports of entry”, 5/15/23.
24 Vistra.com, “Mexico’s Immex program: A summary for foreign investors”.
Carefully consider the Funds’ investment objectives, risk factors, and charges and expenses before investing. This and other information can be found in the Funds’ prospectuses or, if available, the summary prospectuses, which may be obtained by visiting the iShares Fund and BlackRock Fund prospectus pages. Read the prospectus carefully before investing.
Investing involves risk, including possible loss of principal.
International investing involves risks, including risks related to foreign currency, limited liquidity, less government regulation and the possibility of substantial volatility due to adverse political, economic or other developments. These risks often are heightened for investments in emerging/ developing markets or in concentrations of single countries.
Funds that concentrate investments in specific industries, sectors, markets or asset classes may underperform or be more volatile than other industries, sectors, markets or asset classes and then the general securities market.
Technology companies may be subject to severe competition and product obsolescence.
This material represents an assessment of the market environment as of the date indicated; is subject to change; and is not intended to be a forecast of future events or a guarantee of future results. This information should not be relied upon by the reader as research or investment advice regarding the funds or any issuer or security in particular.
The strategies discussed are strictly for illustrative and educational purposes and are not a recommendation, offer or solicitation to buy or sell any securities or to adopt any investment strategy. There is no guarantee that any strategies discussed will be effective.
The information presented does not take into consideration commissions, tax implications, or other transactions costs, which may significantly affect the economic consequences of a given strategy or investment decision.
This material contains general information only and does not take into account an individual’s financial circumstances. This information should not be relied upon as a primary basis for an investment decision. Rather, an assessment should be made as to whether the information is appropriate in individual circumstances and consideration should be given to talking to a financial professional before making an investment decision.
The information provided is not intended to be tax advice. Investors should be urged to consult their tax professionals or financial professionals for more information regarding their specific tax situations.
The Funds are distributed by BlackRock Investments, LLC (together with its affiliates, “BlackRock”).
The iShares Funds are not sponsored, endorsed, issued, sold or promoted by Bloomberg, BlackRock Index Services, LLC, Cboe Global Indices, LLC, Cohen & Steers, European Public Real Estate Association (“EPRA® ”), FTSE International Limited (“FTSE”), ICE Data Indices, LLC, NSE Indices Ltd, JPMorgan, JPX Group, London Stock Exchange Group (“LSEG”), MSCI Inc., Markit Indices Limited, Morningstar, Inc., Nasdaq, Inc., National Association of Real Estate Investment Trusts (“NAREIT”), Nikkei, Inc., Russell, S&P Dow Jones Indices LLC or STOXX Ltd. None of these companies make any representation regarding the advisability of investing in the Funds. With the exception of BlackRock Index Services, LLC, who is an affiliate, BlackRock Investments, LLC is not affiliated with the companies listed above.
Neither FTSE, LSEG, nor NAREIT makes any warranty regarding the FTSE Nareit Equity REITS Index, FTSE Nareit All Residential Capped Index or FTSE Nareit All Mortgage Capped Index. Neither FTSE, EPRA, LSEG, nor NAREIT makes any warranty regarding the FTSE EPRA Nareit Developed ex-U.S. Index, FTSE EPRA Nareit Developed Green Target Index or FTSE EPRA Nareit Global REITs Index. “FTSE®” is a trademark of London Stock Exchange Group companies and is used by FTSE under license.
©2023 BlackRock, Inc or its affiliates. All Rights Reserved. BLACKROCK, iSHARES, iBONDS, ALADDIN and the iShares Core Graphic are trademarks of BlackRock, Inc. or its affiliates. All other trademarks are those of their respective owners.
iCRMH1023U/S-3059311
This post originally appeared on the iShares Market Insights.
Read the full article here


