When I turned bullish on Small Caps this spring, I put a Buy recommendation on the Avantis US Small Cap Value ETF (NYSEARCA:AVUV). Since making that recommendation, AVUV has done quite well, up 12.4% in price terms versus 7.85% for the S&P 500. It should be noted, however, that several weeks before making this call, I also put out a Strong Sell on IWM, the iShares Russell 2000 ETF, with the caveat that this was related to seasonal factors and flaws in how the index that it tracks, the Russell 2000, is constructed, and not due to my underlying view (which was neutral at the time) on Small Caps. Although my call looked prescient for the first six weeks, when IWM was down 7% and significantly underperforming both SPY and AVUV, over the entire period, it too has also outperformed the S&P 500, up 7.95% versus an increase of 4.01% for the S&P 500. Despite the recent outperformance of Small Caps, I re-iterate my Buy Rating on AVUV.
I. Why It’s A Good Time To Invest In Small Caps
1) Concentration Risk In The S&P 500
There has been a multi-year bull market in Tech stocks. As a result, significant concentrations have built up in the S&P 500, and it no longer offers adequate diversification.
Chart 1: S&P 500 Weighting By Sector
S&P Global and State Street Global Advisors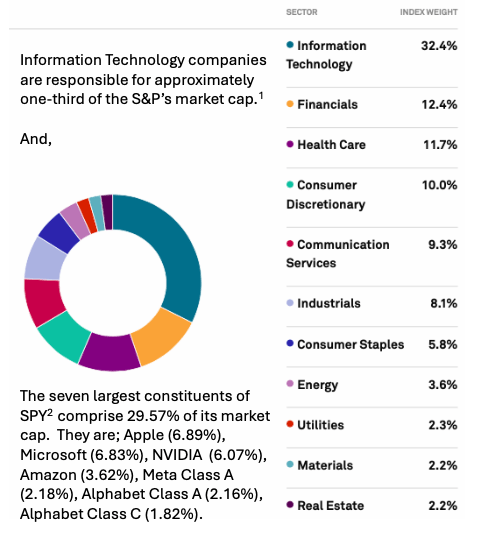
1 As of June 30, 2024
2 As of July 26, 2024
2) Small Caps Offer Diversification
As per Table 1, at 5%, AVUV has a lower weighting in the Information Technology Sector than the Russell 2000 and its related sub-indices.
Table 1: Sector Weights Various Small Cap Investment Vehicles*
| Sector | AVUV | IWM | IWN | IWO |
| Information Technology | 5.07% | 12.72% | 5.58% | 22.28% |
| Financials | 27.73% | 15.00% | 25.13% | 5.10% |
| Health Care | 1.84% | 15.06% | 8.62% | 21.38% |
| Consumer Discretionary | 18.71% | 7.76% | 13.24% | 12.22% |
| Communication Services | 1.81% | 1.24% | 1.10% | 1.37% |
| Industrials | 18.06% | 18.85% | 15.40% | 22.24% |
| Consumer Staples | 3.53% | 2.85% | 2.08% | 3.62% |
| Energy | 16.07% | 7.76% | 10.22% | 5.36% |
| Utilities | 0% | 2.74% | 3.84% | 1.66% |
| Materials | 6.65% | 3.93% | 4.54% | 3.32% |
| Real Estate | 0.54% | 5.82% | 10.25% | 1.46% |
* As of June 30, 2024 – Sector Weights may add up to more than 100% due to rounding
3) Short-Term Rates Are Expected To Fall
Anecdotally, small firms are more exposed to movements in short-term interest rates than large caps. I dislike relying upon anecdotes, or upon conclusions or statements of fact where I can’t verify the underlying data. Nevertheless, I believe that the following statements are from reputable sources that can be relied upon.
- On November 23, 2023, S&P Global wrote that, “Small cap stocks tend to feel the impact of changes in interest rates more than their large cap equivalents. Not only do small cap companies have a greater dependency on shorter term financing to help them survive, but they tend to rely more heavily upon floating rate debt, strengthening the immediate impact of any increases in interest rates upon their profits.“
- Newton Investment Management is owned by BNY Mellon. In this report dated June 17, 2022, it states that, “Small and SMID-cap companies, carrying twice as much debt as their larger counterparts, are more sensitive to short-term interest rates.“
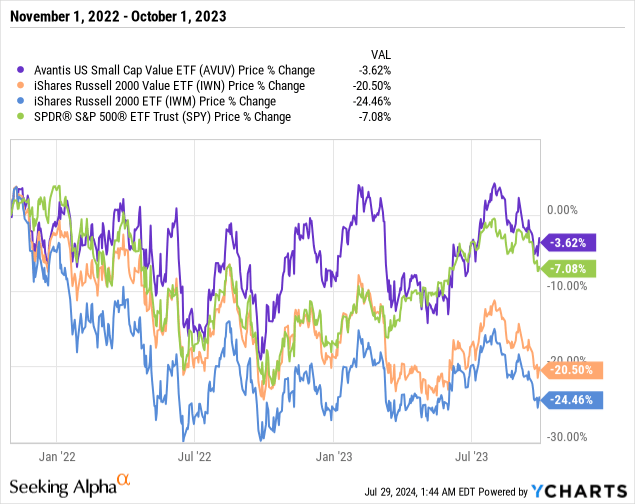
On November 1, 2021, 3-month T-Bills yielded 0.05%. By October 1, 2023, 3-month rates had risen to 5.47%. If one uses IWM as a proxy for small caps, then as per Graph 1, it does appear that increases in interest rates have had a greater effect upon small caps than upon large caps. However, during this time, the fund managers at AVUV were able to significantly outperform SPY, as well as other small cap indices such as IWM, and IWN, the iShares Russell 2000 Value ETF, which tracks the Index that AVUV is benchmarked to.
Graph 1: Performance Of Various Small Cap And Large Cap ETFs During A Period Of Rising Short-Term Rates
The market has started to price in lower rates. June’s inflation report was released on July 15, and CPI came in at 3.0%, down from 3.3% in May, and better than the market’s expectation of 3.1%. Later that day, Federal Reserve Chair Jerome Powell said that with regard to rate cuts, “The implication of that is that if you wait until inflation gets all the way down to 2%, you’ve probably waited too long…“. The market rapidly factored this information into its consensus projections, and the CME Group’s FedWatch Tool showed an 89% chance of at least one rate cut by the September 17-18 Fed meeting, up from 73% on Wednesday, July 10, and around 50% the week before.
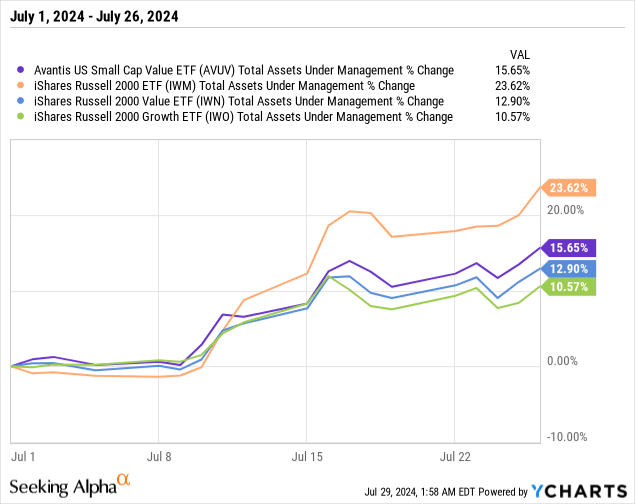
Money flooded into small caps. ETF Channel, a website that tracks all ETFs, not just Small Caps, reported on July 25, 2024, that, “Comparing units outstanding versus one week ago, at the coverage universe of ETFs at ETF Channel, the biggest inflow was seen in the iShares Russell 2000 ETF, which added 13,150,000 units, or a 4.3% increase week over week.“
Graph 2: Change in AUM For July 2024
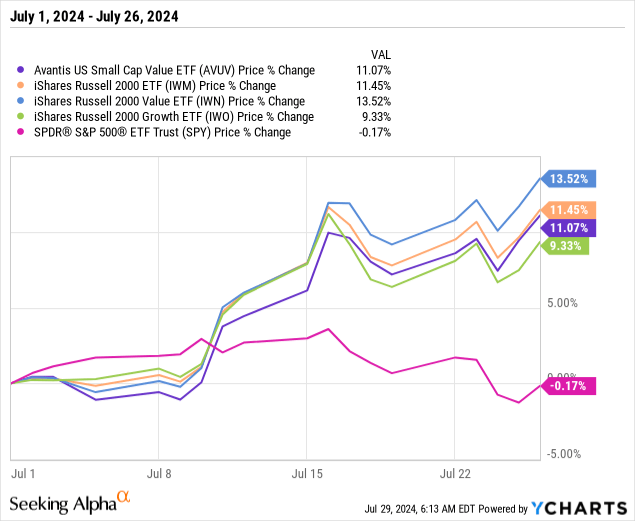
Many believe that this is the start of a long-awaited sector rotation because for the first time in a long time, Small Caps have significantly outperformed Large Caps.
Graph 3: Price Action Small and Large Cap ETFs, July 2024
Optimism abounds: In this CNBC Interview conducted on July 25, 2024, Tom Lee of Fundstrat called for a 15% rise in the Russell 2000 for the month of August, even after July’s month to date double-digit gain. He also forecast that the S&P 500 would be flat during this month.
As detailed below, I think that the summary statistics provided by FTSE Russell are misleading at best, and that the index is a black box. So, I would love to have access to the data that Mr. Lee used to calculate the median P/E Ratio of the index as being 11, but economics (my own personal ones) prohibit this.
I encourage readers to watch the interview, but in any case, here are the reasons why Mr. Lee is so bullish, with my thoughts in italics at the end of each bullet point.
- Mr. Lee noted that for 10 of the trading days preceding the interview, the Russell 2000 was up by more than 1%. Historically, nine times out of ten since 1979, such price action preceded large gains of 100% in relatively short periods of time. In all honesty, the market seems to already have priced in an early Fed Rate Cut, and even if one should occur, I worry about a buy the rumour sell the fact reaction. Should a narrative of outsized gains become widespread, I will treat it as a reason to consider selling Small Caps. But over the medium to long term, I am positive on small caps.
- Donald Trump is likely to be elected. As a result, red tape and regulations will be cut, and it will be easier for M&A activity to occur, especially within the regional bank sector. Setting aside the Kamala Harris factor, in 1980, there were 14,469 banks in the United States. By the end of 2022, this number was 4,135. There doesn’t appear to be any noticeable difference between the pace of bank consolidation during GOP administrations and Democrat administrations. Still, I suppose takeovers of small banks by large money centre banks could be more difficult under President Harris than it would be under President Trump. However, I view this as a secondary factor at best. So, all other things being equal, any surge in the polls by Kamala Harris should not be treated as a signal to sell Small Caps.
- Lower rates will engender confidence in CEOs who are considering M&A activity. While this is hard to measure, I suppose it can’t be discounted, especially because lower rates will make it less expensive to use debt to finance takeovers and acquisitions.
- Lower rates will have a number of positive effects for regional banks. As discussed below, I fully agree with this.
It should be noted, that if the Fed doesn’t act as the market assumes it will, for example, if it raises rates instead of cutting them, all bets are off.
4) Reasons To Be Positive About Regional Banks
At the end of Q2 2024, roughly 8% of the Russell 2000 Index’s market cap was due to regional banks, and approximately 16% of the Russell 2000 Value Index consisted of regional banks. AVUV had a market weight position, and on April 25, 2024, I expressed concern that, “Fifteen percent of AVUV’s portfolio is invested in regional banks, and the entire sector has been under pressure for the better part of a year.” After reviewing some of AVUV’s holdings, I concluded that, “So, while I still have concerns, it appears that some regional banks have been unfairly penalized by the market, and that there may be value in the sector.“
In retrospect, I need not have worried about regional banks.
Graph 4: Regional Banks Have Outperformed
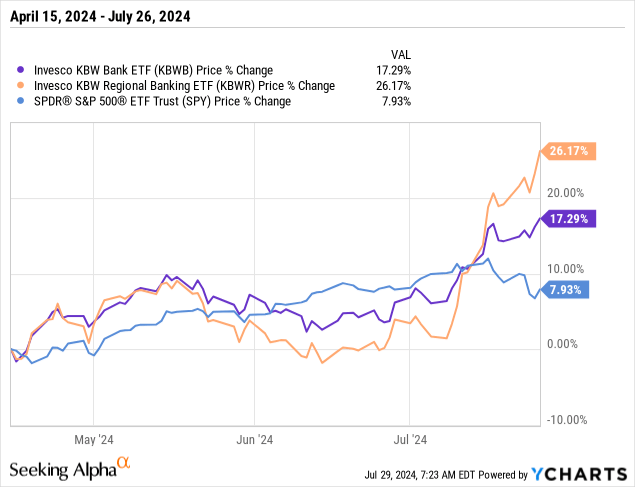
Prior to the recent rally, regional bank valuations had been under pressure for two reasons. First, there were concerns over potential large unrealized losses in the bond portfolios of regional banks, and the market wasn’t certain of the extent of the issue. Second, there were concerns over their exposure to Commercial Real Estate, in particular, to the office sector.
Here’s what’s changed.
a) Silicon Valley Bank’s bankruptcy was caused by a run on deposits that was sparked by concerns over unrealized losses in its bond portfolio. When SVB announced a loss of $1.8 Billion on March 8, 2023, Ten-Year Treasury Yields were circa 4%. They subsequently peaked at 5% in October of that year, and this was the height of market anxiety. Today, rates are at 4.15%; the market has skated many banks that were offside, back onside.
b) Banks lend long and borrow short. For the past two years, the yield curve has been inverted and this has been a drag on profitability. The curve has started to de-invert, and cuts in the Fed Funds rate usually have a greater effect upon short-term interest rates than long-term interest rates. So, this trend will likely continue.
Graph 5: Ten Year – Two-Year Treasury Yield Spread
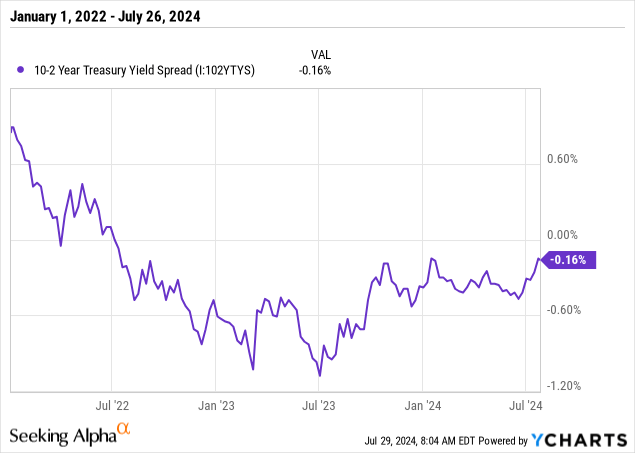
c) Regional Banks compete with non-bank lenders such as Fintechs. Traditionally, banks have had a funding advantage. However, as per above, there have been concerns about the stability of the banking system. These concerns, along with the high rates on offer in many money market funds, eroded this advantage.
Graph 6: Total US Bank Deposits
Federal Reserve Bank Economic Data The Federal Reserve Bank of St. Louis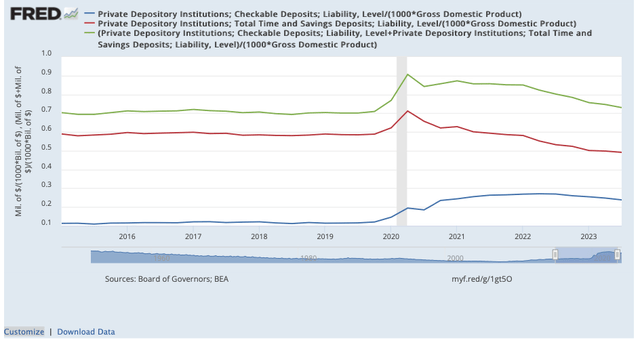
There is early evidence that this advantage is starting to re-establish itself. On May 29, 2024, the FDIC reported that uninsured deposits increased by $63.3 billion, or 0.9 percent, in the first quarter of 2024. This was the first reported quarterly increase since the fourth quarter of 2021.
d) There is more clarity with regard to the worst case in commercial real estate. On June 28, 2024, the Fed released the results of its 2024 Stress Tests of 31 large US Banks. The modelling assumptions made in the Severely Adverse Scenario are; i) The Unemployment Rate rises to 10%, ii) Real GDP decreases by 8.5%, iii) The housing market sells off by 36%, iv) Commercial Real Estate Prices fall by 40%, v) 3-Month T-Bill Yields fall to 0%, vi) Credit Spreads on BBB corporate bonds increase from 4.1% to 5.8%, and, vii) The stock market falls by 55%. All in all, a truly horrific scenario.
Here are some takeaways with regard to CRE.
- First, the banking system had adequate capital to absorb the losses that are forecast to occur in such a scenario. This means that the likelihood of a systematic banking collapse, as per the Credit Crunch, is remote.
- Second, as per page 20 of the results, the aggregate charge off ratio in the Severely Adverse Scenario for the 31 largest banks in the US due to Domestic CRE loans was 8.8%, for a total amount of $77.2 billion.
- Third, the Fed’s Stress tests were conducted using a starting point of Q1 2024. A number of Commercial Real Estate Firms describe the CRE market in similar terms as this July 5, 2024, report by Green Street. “Property pricing bottomed late last year, and it’s been on the rise since then,” said Peter Rothemund, Co-Head of Strategic Research at Green Street. “There are a few property types where pricing is lower, but for everything else, pricing is flat or higher since the end of last year.” While such firms may have a vested interest in giving optimistic news, at least they aren’t pessimistic.
- Finally, as per the FDIC report referenced earlier,
As seen in this chart, deterioration is concentrated in the largest banks, which reported a PDNA (Past Due Non Accrual) rate of 4.48 percent, well above their pre-pandemic average rate of 0.59 percent. … The next tier of banks, those with between $10 billion and $250 billion in assets, is also showing some stress in non-owner-occupied property loans. This cohort’s PDNA rate was 1.47 percent in the first quarter, up from 1.35 percent in the fourth quarter and above its pre-pandemic rate of 0.66 percent.
If anything, it appears as if large banks have a bigger issue, in relative terms, than smaller banks do.
II. Why I Prefer AVUV Over ETFs That Track The Russell 2000 Or Its Sub-Indices
One of my core investing beliefs is to never invest in ETFs or investment vehicles that passively track the Russell 2000 Index, or subsets of it such as the Russell 2000 Value Index and the Russell 2000 Growth Index. To be clear, this is independent of any underlying view that I might have on Small Caps at any particular time. Bearish on Small Caps? Avoid the Russell 2000. Bullish on Small Caps? Avoid the Russell 2000 – find a better way to express that view.
It’s been a good call over the years because the Russell 2000 has underperformed the S&P 500 in every time horizon that is commonly cited. And except for this year, the same is true for other Small Cap Indices such as the S&P 600 and the CRSP US Small Cap Index. I’ve written extensively about why I dislike the Russell 2000, but in brief, here are some of its flaws;
- The Russell 2000 is a Black Box. Many of the companies in the index are too small to be covered by equity analysts, so P/E Ratios are based on historic earnings, and not on forward projections. This is just the nature of the beast. However, approximately 30% of Russell companies have negative earnings, and this figure has been as high as 40%. In the past, negative earnings were netted against earnings from profitable companies. This led to ridiculous P/E Ratios in excess of 100, so now, FTSE Russell omits the figures from unprofitable companies to calculate its P/E Ratio. Consider two hypothetical indices with the same two companies, both priced at $10 a share. Company one earns $1 a year, and company 2 loses 50 cents a year. Most indices would report a P/E Ratio of 20 – $10 divided by net earnings of 50 cents. However, using the Russell’s methodology, the P/E Ratio is 10. One company priced a $10 divided by $1 of earnings, and one company that isn’t considered. It’s a nonsense, and I’m not even sure which companies are used to calculate figures like Price / Book because FTSE Russell doesn’t respond to emails asking for clarification.
- The Russell 2000 has 1,921 companies. The Russell 2000 Value Index has 1,402 companies, and the Russell 2000 growth Index has 1,054 companies. Given that only companies that are in the overall Russell 2000 index can be included in the Growth and the Value Indices, it would appear that there are at least 535 Small Cap companies that are both Growth and Value companies. Go figure.
- There are numerous academic studies which show that quality screens that exclude companies with negative earnings lead to better investment performance. The S&P 600 has such a screen, it has outperformed the Russell 2000 Index. AVUV uses the French-Fama five factor model as an initial screen to make a first cut, before its fund managers make further refinements. One of the five factors is company profitability. So automatically, a large proportion of the companies in IWN, those that are unprofitable, are excluded from AVUV’s universe of investible companies.
- Most other indices re-constitute and re-balance four times a year, usually via a process that is opaque to the market. The Russell 2000 indices re-constitutes once a year in the last week of June, and a list of preliminary revisions is usually made available to the market in May. Various studies attribute the negative alpha of the Russell 2000 to this factor, and those looking for more information can read previous articles that I have written which cite these studies. The following effects have been observed;
- Front running has been an issue.
- Significant transaction costs are incurred because these are illiquid stocks with wide Bid / Offer spreads, and a year’s worth of transactions happens in a relatively short period of time.
- Finally, high momentum stocks at the top of the range that are promoted into the Russell 1,000 must be sold. They are replaced with other high momentum stocks, that have been promoted into the Russell 2000, but the market cap of companies entering the index is a fraction of the stocks leaving the index. This means that the overall momentum of the index decreases.
III. Conclusion
Investors should consider Small Caps if for no other reason than to increase diversification in their portfolios.
Small Caps have outperformed large caps significantly during the month of July, and many prognosticators believe that this is the start of a larger rotation. While there are legitimate reasons to fear that the market is getting ahead of itself, I believe that in the medium to long term, Small Caps will finally, after 10 years, outperform Large Caps.
In the four and a half years that it has been in existence, AVUV has marginally outperformed the S&P 500 (a total return of 96% versus 84%). It has also delivered nearly double the returns of Small Cap Indices such as the Russell 2000, the S&P 600, and the CRSP US Small-Cap Index.
It remains my preferred choice for investing in Small Caps. Furthermore, it remains a Buy.
Read the full article here


