Thesis
When investing, it is paramount to understand what it is that you are buying. It becomes even more important when dealing with complex products that have leverage and multiple risk factors. BlackRock Income Trust (NYSE:BKT) is such a product. The vehicle is a closed end fund that purchases agency MBS bonds and leverages them up in order to generate a high dividend and a rates based return profile.
There have been a number of articles regarding this CEF that seem to completely miss the mark in terms of what the fund does and what the underlying risk factors are. We have been covering this name for a while, with our last article about a year ago being a ‘Buy’:
Prior Rating (Seeking Alpha)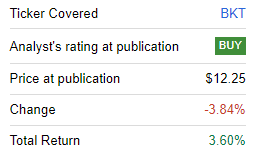
The fund is marginally up on a total return basis since, but the turmoil has been significant. We did not anticipate the significant spike-up in rates in October 2023, but as predicted, MBS bonds have delivered on a total return basis, and we believe they will continue to do so as we leave today’s peak rates environment.
We are going to revisit BKT in this article and shed some further light on what the CEF does, its dividend, and our view on the fund’s risk factors and forward.
Packaging MBS bonds in a CEF
The CEF has a very simple set-up, and it holds Agency MBS bonds with leverage on top:
Holdings (Fund Website)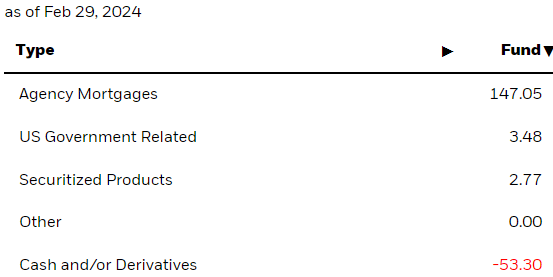
We can see ‘Agency Mortgages’ making up 147% of the fund, with the leverage recorded in the ‘Cash and/or Derivatives’ line. As a reminder, Agency MBS bonds are AAA securities backed by both mortgages and an implied government guarantee:
Mortgage-backed securities (‘MBS’) are investments based on pools of home mortgages. Banks and mortgage companies sell mortgages to other companies. These groups then bundle the mortgages together. If you invest in MBS, you are buying a claim to the cash flow coming from these debts. You are, in effect, lending money to homeowners and getting back money in the form of their mortgage payments. There are two types of mortgage-backed securities: agency or non-agency. Agency MBS are created by government or quasi-government agencies.
Agency MBS yields are very closely correlated to treasuries, and they trade at a wider spread to outright government bonds:
MBS vs Tsy spread (JP Morgan)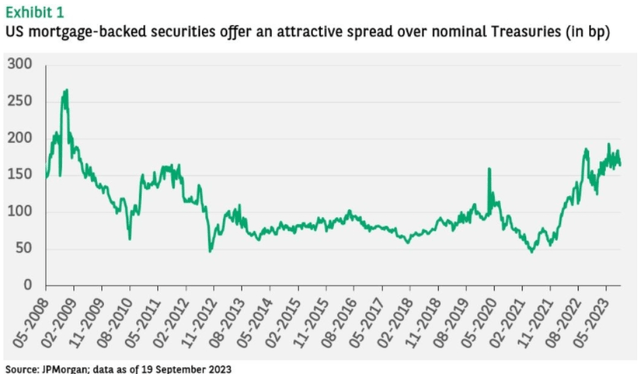
The above graph, courtesy of JP Morgan, gives us a sense of the historic spread offered by MBS over Treasuries. On the back of a higher rates environment, the spread has widened to over 150 bps.
MBS bonds do not yield 9%
What investors seem to not understand regarding this structure is that by definition, given the asset class, the 9% distribution yield is not going to be supported. After the leverage is taken into consideration, the dividend yield from a cash-flow perspective generated by the underlying pool of assets is somewhere close to 6%. Will this pool of assets generate 9% yields? Not unless treasuries yield close to 7%.
CEF asset managers actively engage in the ‘bumping-up’ of distribution yields in order to attract AUM across asset classes. The same is happening here. However, do not expect a distribution cut. Rates have increased significantly in the past two years, with MBS rates as good as they will get any time in the next five years in our view. Given the intent to attract AUM the distribution yield will probably always be unsupported for this CEF.
However, the fund will make up some of the cash shortfalls via its duration profile:
Duration (Fund Website)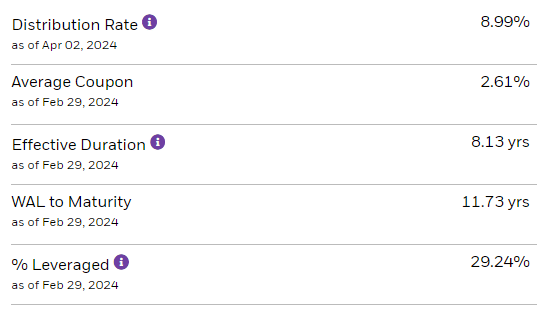
The fund has a 8.13 years duration, meaning that for every 100 bps tightening in MBS spreads, the CEF will generate an 8% capital gain via the NAV of its underlying bonds. As the Fed decreases rates into 2025, the CEF is set for significant capital gains. Think about this name as buying 8 year treasuries with a higher spread and some leverage on top.
If you like Annaly and AGNC you must love BKT
To put BKT in context for investors, it is best to compare it to some mortgage REITs which engage in the same business, but with the additional complexity layer of an operating company:
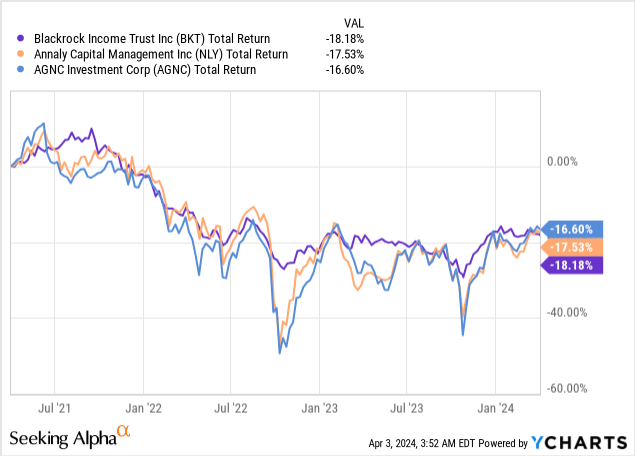
The above graph is a 3-year total return graph depicting BKT, Annaly Capital (NLY) and AGNC Investment Corp (AGNC). Please notice the three tickers have virtually the same total return with a very close correlation. BKT is the least volatile one from the three.
BKT engages in the same business as NLY and AGNC, just in a much ‘cleaner’ fashion. The CEF does not hedge, or engage in any other interest rate swap trade, and it provides for a leveraged take on MBS bonds.
If you like NLY and AGNC here in the macro cycle, then you must love BKT. It will deliver the same result on intermediate time-frames when compared to the much better known mREITs in our opinion.
BKT set for capital gains
We have established above that BKT will likely never make 9% from underlying cash-flows. However, we believe the fund will make up for it via its duration component. The underlying bonds have an 8.13 years duration, which will translate into capital gains as rates move lower.
For every 100 bps in yield moves, BKT will generate a 8% capital gain on its underlying assets. With the Fed set to move rates lower into 2025, expect a 10% plus capital gain from the underlying assets. The actual predicted NAV move for BKT therefore is +6% from actual cash-flows and +10% from capital gains NAV moves, for a total return to exceed 16% in the next 12 months.
The CEF is not going to cut its distribution in our view, but in fact use some of the capital gains to cover the distribution yield. BKT is a cyclical instrument, and thus should only be owned now, in a macro environment where rate cuts are most likely ahead of us.
Conclusion
BKT is a fixed income CEF. The vehicle is an MBS aggregator with leverage on top. While its 9% distribution yield is not supported from underlying cash-flows, the fund will make up for it via capital gains spurned by rate cuts. BKT has a total return profile very closely correlated to NLY and AGNC, so if you like those mREITs in the current macro set-up then you should also consider BKT, the least volatile name from the cohort. We have penciled in a 16% total return for the CEF in the next 12 months, with 6% coming from actual cash-flows and 10% from capital gains as rates move lower, given the 8 year duration exhibited by the CEF assets.
Read the full article here


