Analysis Summary
Today I’ll be covering Chubb Ltd (NYSE:CB), in the financials sector, subsector of property and casualty insurance.
I first covered this stock back in July, so now 3 months later I’m back to review it again using my updated methodology. My last analysis was a Buy rating, which I called correctly as since my rating the price went up 10.14% .
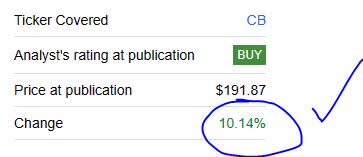
Chubb – price since last rating (Seeking Alpha)
The Switzerland-based company trades on the NYSE and has roots dating to 1985. It provides insurance and reinsurance products worldwide, according to its company profile.
According to the company, they are “the world’s largest publicly traded property and casualty (P&C) insurer, based on market capitalization of $79.1 billion.”
One of its listed peers is The Travelers Companies (TRV), another major player in the insurance space.
I gave this stock a buy rating, again, due to having more strengths in my review than offsetting factors. In fact, it had 5 strengths vs 2 offsetting factors, so I am compelled to reaffirm my bullish rating from July again.
Its strengths include dividends, revenue growth, net income and EPS, capital and liquidity, and share price vs moving average.
Its offsetting factors include valuation and performance vs S&P500.
Two risks to my bullish outlook that I identified are exposure to catastrophe events, and asset risk exposure in their portfolio of investments.
My updated rating methodology as of October 2023 is to analyze the stock holistically across the following 7 categories of equal weight, and if it has more strengths than offsetting factors it gets a buy rating:
dividends, valuation, revenue growth, net income and EPS, capital and liquidity, share price vs moving average, performance vs S&P 500.
Dividends
Here I’ll discuss dividend yield, 10 year dividend growth, and dividend stability. As a dividend-focused analyst and investor, I believe these are vital metrics to look at.
Though not all investors are dividend-oriented, and I appreciate my readers who are not, I think it is an opportunity to generate regular cash flow from holding a stock longer-term. I like to say I am not investing in a stock but into an existing cash flow stream.
First, let’s look at the yield, which is 1.67% as of this article, along with a dividend payout of $0.86 per share, on a quarterly basis.
However, I cannot determine if it is a great yield or not without comparing to its overall industry.
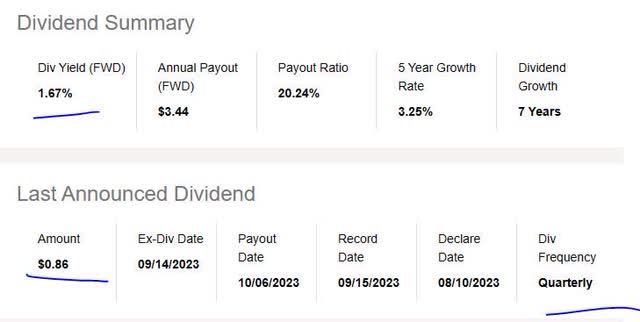
Chubb – div yield (Seeking Alpha)
In comparison to its sector average, this yield is 59% below the average. I consider this a negative point and I think a reasonable dividend yield would be between 3.5% and 5.5% when considering the sector/industry. My target for a dividend yield would be just above average, or 4.5% to 5%.
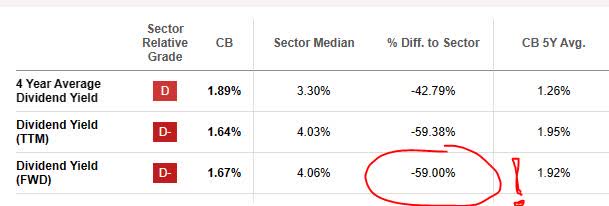
Chubb – div yield vs sector (Seeking Alpha)
Further, in comparing this stock’s yield vs 3 major insurance peers, it actually hits the bottom of the pack, as you can see in the chart below using a handy yield comparison tool provided by Seeking Alpha:
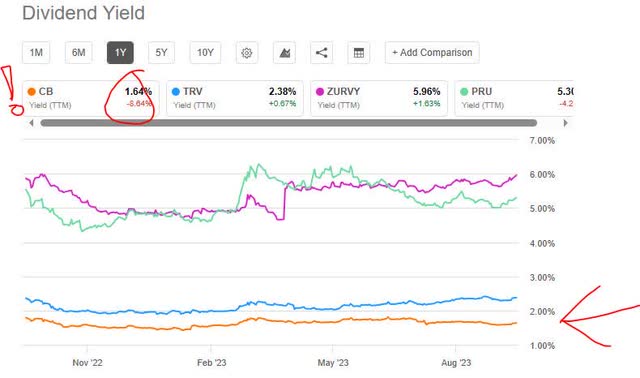
Chubb – div yield vs peers (Seeking Alpha)
Next, I’m looking at the 10-year dividend growth rate, shown in the chart below, which shows a steady growth from 2015 onwards. I think that is a major positive point, and I always look for a good dividend growth story to tell, backed by the data, so the story here is one of growth and a commitment to return capital back to shareholders.
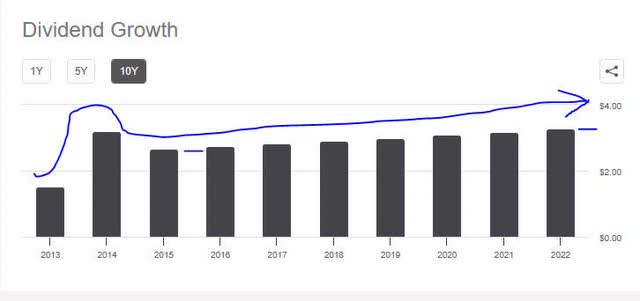
Chubb – dividend 10 yr growth (Seeking Alpha)
Finally, I want to see dividend payout stability, especially since many of my readers rely on the stable dividend income that these types of stocks offer. Again, I think of it like investing into an existing cash flow stream without having to build the business from scratch on my own.
In looking at the table below, you can see stable payouts over the last few years, with 3 dividend increases in this time period, a major plus!
If I was holding 1,000 shares, for example, I could realize $860 in quarterly cash flow from the dividends on this stock. (1,000 shares x $0.86 per share). That is the type of portfolio I try to structure with these types of stocks.
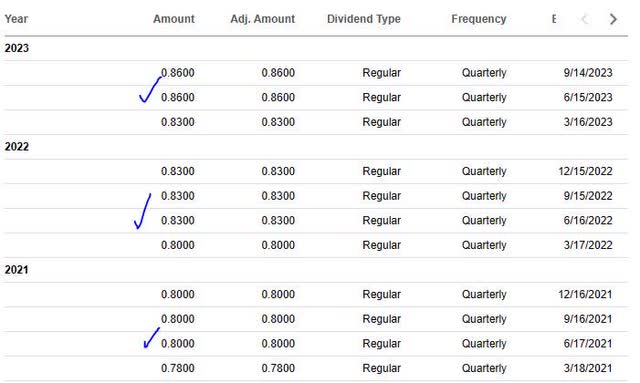
Chubb – dividend history & stability (Seeking Alpha)
Based on the evidence, I consider the category of dividends a strength for this stock, on the basis of steady dividend payouts and dividend growth outweighing the below-average yield.
Valuation
To analyze the valuation, to simplify things I have chosen a single metric to focus on, and that is the price-to-earnings ratio (P/E), both the trailing and forward P/E, as it tells me what the market is pricing this stock at in relation to its earnings.
Although a lower-than-average fwd P/E may indicate the market is having lower confidence in the forward earnings potential of this stock, it also presents a value-buying opportunity, in my opinion, if most of the other fundamentals are strong.
In this case, though, the valuation is somewhat above average so perhaps the market is increasingly confident in forward earnings potential on this company.
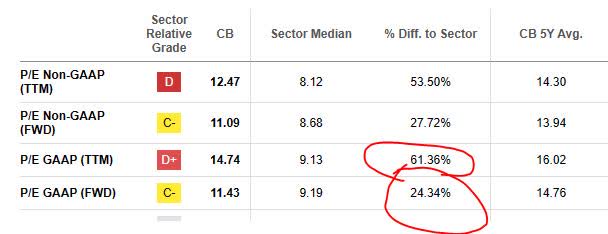
Chubb – PE ratio (Seeking Alpha)
I consider this stock modestly overvalued compared to its industry, on a forward basis, and an excessive overvaluation on a trailing basis.
Compared to its listed peer, Travelers Companies, that firm’s forward P/E is actually about 40% higher than the sector average, so much more overvalued than Chubb is. Based on this industry’s average range of around 9.15x earnings, I think a reasonable valuation would be 8x to 11x earnings.
Based on the data, I think this valuation metric is an offsetting factor for this stock and I don’t see it as an undervaluation opportunity right now.
Revenue Growth
Now, we’ve come to a topic I think many analysts and investors look at, which is the top-line revenue growth. Because this metric essentially shows money made before expenses and taxes, it does not indicate this firm’s effectiveness at managing costs, but at growing its revenue side of the house.
Manageable growth is important, in my opinion, because companies have competition and are striving to capture market share in their space.
For this company, we can see from the most recent income statement that it achieved a YoY increase in total revenue:
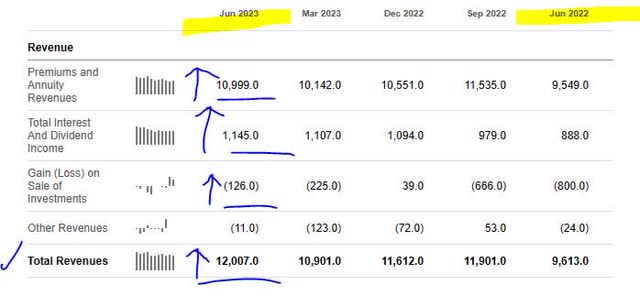
Chubb – total revenues YoY (Seeking Alpha)
Until the Q3 results are released, for the purposes of this article we will use the Q2 data above. From the above table, we can see that the core business of making money from insurance premiums and annuities did very well, as did earning money from interest-bearing assets. In addition, another call out is their losses on selling assets also decreased, which is a plus.
As I mentioned in an earlier article, for those readers less familiar with the insurance industry, these insurers “invest” a lot of their excess cash from premiums into an asset portfolio with the goal of making more money, and a lot of that is in assets that earn interest, which is relevant this year considering the elevated rate environment we are in!
Overall, I think the data shows that top-line revenue YoY growth is a strength for this stock’s rating, as there is not only YoY growth but also revenue diversification and a benefit from the rate environment.
Net Income and EPS
Net income and earnings per share get their own section here to make the analysis easier to understand.
Looking at the most recent quarterly results available, this firm achieved a YoY growth in net income and the basic earnings per share “EPS” increased on a YoY basis.
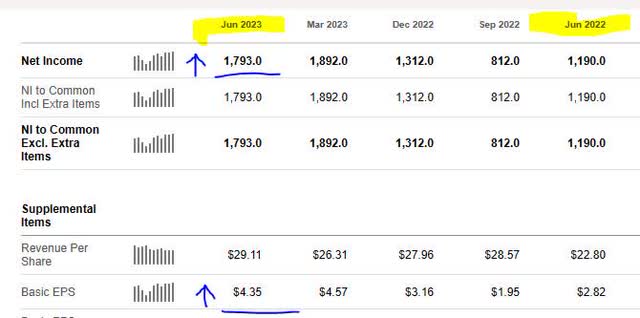
Chubb – net income and EPS (Seeking Alpha)
Because this is a re-rating, I will not belabor the topic too much, and will mostly say that I am impressed in the YoY jump in profitability which should also make investors more confident in this equity.
I think this category of net income and EPS is a strength for this stock’s rating.
Capital and Liquidity
Here we focus one or more items related to capital & liquidity strength of the company overall, which I think is important for any going concern.
The following from the Q2 earnings release is worth calling out because it shows all 4 major ratings agencies giving top marks to Chubb in terms of financial strength ratings:

Chubb – ratings agencies (company q2 release)
Further, I am looking at the following graphic from the Q2 presentation as well, showing $205B in total assets and $52.9B in equity.
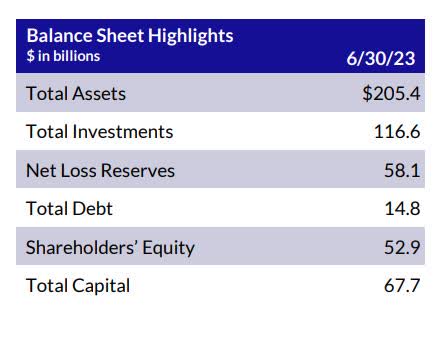
Chubb – balance sheet highlights (company Q2 presentation)
Further, from its cash flow statement we can see that the firm has positive free cash flow both levered and unlevered as well as positive free cash flow per share. Positive cash flow is a plus in my book!
Since we mentioned something about assets already, I just want to call out one headwind I have seen with insurers lately, and that is a YoY uptick in benefits paid out:

Chubb – policy benefits (Seeking Alpha)
Though this is an income statement item and not a balance sheet one, it is important to mention because it can have an impact on cash. Remember that the business model of a major insurer like this is to take in a lot more in premiums than it has to pay out in claims, and sometimes it gets hit with major weather events that have a business impact if a large number of claims have to suddenly be paid out in a single quarter.
Based on the evidence found overall, though, I consider this firm’s capital and liquidity situation a strength to its overall rating.
Share Price vs Moving Average
Here, we will briefly discuss whether I think the current share price presents a value-buying opportunity, and to do so I compare it vs the 200-day simple moving average (“SMA”), which is a great long-term trend indicator in my opinion.
So, let’s first take a look at the current price chart as of the writing of this analysis:
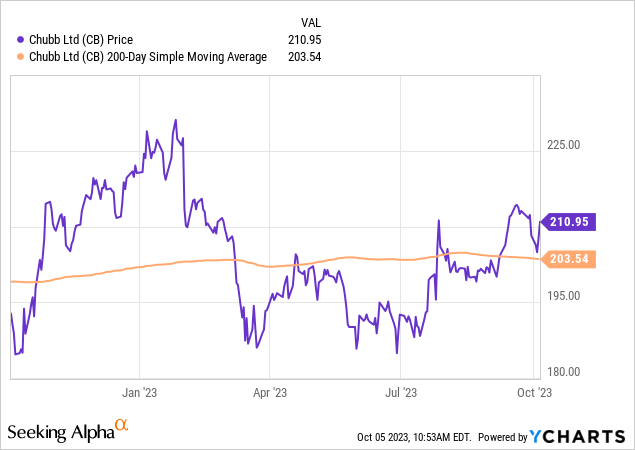
The share price is $210.95, which is 3.6% above the 200-day SMA of $203.54.
My current buying strategy is to look for crossovers, where the price crosses below the 200 day SMA after a period of bullishness. This could be a buying signal, if the other fundamentals are otherwise strong.
In this case, however, the crossover already occurred this summer, followed by a rebound above the average, and a decline, but the average is still providing a support line right now. The question is whether it is too expensive to buy now?
To answer that I plugged the numbers into the following very simplified trading simulation. My portfolio goal? Buy 100 shares at the current price, hold 1 year, and achieve at least 10% or better capital gain (unrealized) by then. At the same time, I have to anticipate losses too so my maximum loss tolerance is a -20% capital loss (unrealized).

Chubb – trading simulation (author analysis)
In the above simulation, I tested a future share price that is +15% above the current moving average, and one that drops -15% below the moving average. In scenario A, I project a capital gain of 10.96%, while in scenario B I project a loss of -17.99%. Both scenarios are in line with my goal for gains/losses.
Based on this simulation, I think the current share price is a strength in my overall rating, and is within the zone for being a value buying opportunity.
Performance vs S&P 500
The following is a comparison of the 1-year price performance of this stock vs the S&P 500 index. I have included this metric in my updated rating methodology so as to compare this equity to a major market index that is tracked often and its ability to outperform it, in terms of momentum.
I find this relevant because market momentum can also tell a story about a stock, and here it tells me the market is somewhat less excited about this stock in this time period, that let’s say a big tech stock like Facebook parent Meta Platforms (META) whose same chart shows it outperformed this index by a lot.
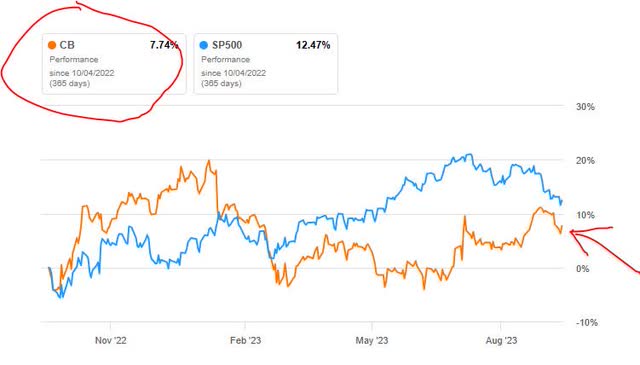
Chubb – performance vs S&P500 (Seeking Alpha)
The data showing Chubb underperforming vs this index is an offsetting factor to my rating, as it shows more lukewarm market momentum on this equity.
Risk to My Outlook
Two risks to my bullish outlook would be the downside risk of business impacts from catastrophe events, as well as asset exposure to commercial real estate particularly office properties which have not gotten good press lately.
The first risk is common to major insurers, and it is not possible to always predict major weather events or natural disasters ahead of time, so that is going to be a continual risk for these types of companies like Chubb.
The second risk, however, is worth mentioning as often I get comments from readers asking about asset risk exposure. As you can see from the company’s own data below, they do not mention any significant exposure to office properties, but rather have a large portion of their assets invested in what appears to be fixed-income securities.
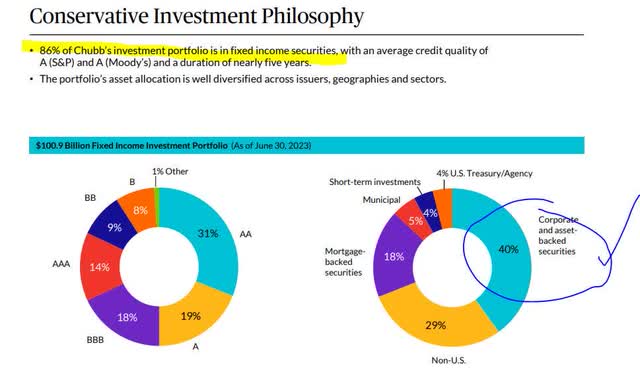
Chubb – asset portfolio (company Q2 presentation)
My counterargument to the bears on this stock is that the current interest-rate environment will continue to favor this company’s asset book, despite some hits it took to the book value of these assets:
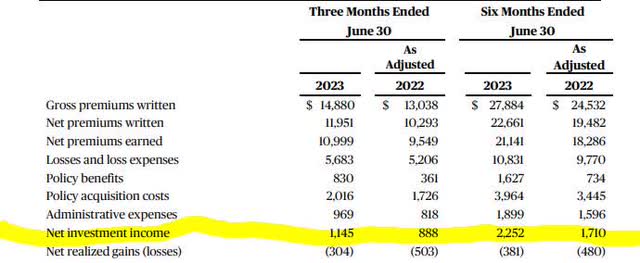
Chubb – net investment income (company Q2 presentation)
Consider the growth in net investment income, coupled with fewer net realized losses on assets. We are talking about $1.1B in net investment income in the last reported quarter, which is a serious figure!
In closing, my bullish sentiment on this stock remains and I am reaffirming my buy rating from July, as well as anticipating more positive outlook after the Q3 results which are almost just around the corner now that we are in October.
Editor’s Note: This article was submitted as part of Seeking Alpha’s Best Value Idea investment competition, which runs through October 25. With cash prizes, this competition — open to all contributors — is one you don’t want to miss. If you are interested in becoming a contributor and taking part in the competition, click here to find out more and submit your article today!
Read the full article here


