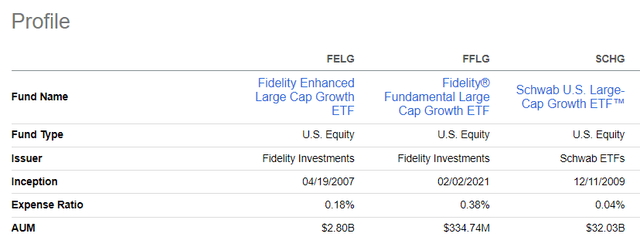
Continuing my series of articles that dissect exchange-traded funds focused on stocks with rich growth premia, today I would like to initiate coverage of the Fidelity Fundamental Large Cap Growth ETF (BATS:FFLG). Incepted in 2021 and previously known as the Fidelity Growth Opportunities ETF (traded with the ticker FGRO), FFLG changed its strategy in February of this year and was renamed as a consequence. It also became a fully transparent fund, and its expense ratio was cut from 59 bps to 38 bps to boot.
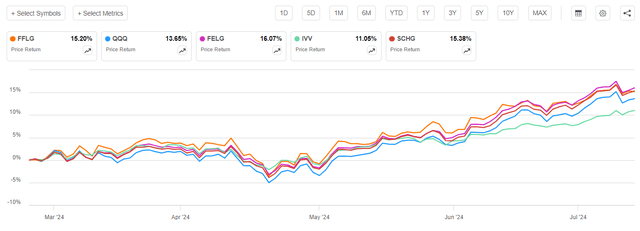
Since February 26, with the new strategy, this growth ETF has seen some solid momentum, not only beating the U.S. market I usually proxy with the iShares Core S&P 500 ETF (IVV), but also the much growthier Invesco QQQ Trust ETF (QQQ).
Seeking Alpha
This is a decent result, yet FFLG has been unable to beat the Schwab U.S. Large-Cap Growth ETF (SCHG), which is one of my favorite long-duration equities-focused ETFs with razor-thin fees. Moreover, the Fidelity Enhanced Large Cap Growth ETF (FELG), which I covered in June, has also been a bit stronger during that ebullient period. That is to say, FFLG does not have a decisive edge over other growth strategies.
In the article, I would like to focus on FFLG’s factor credentials compared to those of SCHG and FELG. I will illustrate that while FFLG has a rather robust factor mix with remarkable growth characteristics, there is no strong enough reason to favor it over FELG, let alone SCHG, an ETF that comes with a 4 bps expense ratio.
FFLG investment strategy
From the Fidelity website, we know that this vehicle is managed actively, with a focus on large-cap companies with “above-average growth potential.” Large caps are defined
as those whose market capitalization is similar to the market capitalization of companies in the Russell 1000® Index or the S&P 500® Index.
To measure growth characteristics, earnings and revenue data are assessed. The security selection process has the following components:
In buying and selling securities for the fund, the Adviser starts with fundamental analyst research and security recommendations, and reference portfolios managed by the Adviser that are based on fundamental analysis, which involves a bottom-up assessment of a company’s potential for success in light of fundamental factors such as its financial condition, earnings outlook, strategy, management, industry position, and economic and market conditions.
It is also clarified that a single company cannot account for more than a quarter of the portfolio.
FFLG portfolio
As of July 15, FFLG had a portfolio of 91 common stocks, American Depositary Receipts, and unit stocks (according to the holdings dataset available on the Fidelity website). More than 59% of the net assets are allocated to the top ten holdings, so FFLG is clearly top-heavy.
It seems NVIDIA (NVDA) is the stock the ETF has the highest conviction on, as this semiconductor bellwether is its top holding with 13.55% weight. Since NVDA’s multiples are rather stretched and growth rates are lofty, it is the key contributor to FFLG’s growth profile as well as the main detractor from its value characteristics; I will give more color on that shortly.
It is worth noting that FFLG investors should be prepared for some FX risks as ex-U.S. equities can qualify for its portfolio. However, at this juncture, there is only a trace amount of them. For instance, Paris-quoted shares in LVMH Moët Hennessy – Louis Vuitton (Paris ticker MC) (OTCPK:LVMUY) have a 59 bps weight in this portfolio. The ETF also holds London-quoted Global Depositary Receipts in Reliance Industries (London ticker: RIGD) (NSEI ticker: RELIANCE), a Mumbai-based conglomerate; the ‘security type’ in the dataset is a unit stock. It has a 26 bps weight. Since this company does not have a U.S.-quoted ADR, I have excluded it from the factor analysis. Overall, just two stocks have currency other than the U.S. dollar in the ‘currency’ column of the FFLG holdings dataset. They are Louis Vuitton and Shopify (SHOP). RIGD is priced in USD.
Factor mix: comparing FFLG to FELG and SCHG
My calculations show that FFLG has a 66.2% overlap with FELG (23 stocks can be found in both portfolios). Its overlap with SCHG is larger, as 76.2% of its holdings can be found in the SCHG portfolio as well. So there is no coincidence that these vehicles have fairly similar factor stories, though with nuances worth discussing below.
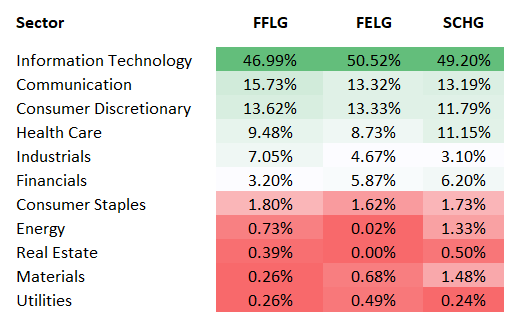
First, the sector mix. To prepare the sector exposure table below, I also used the holdings dataset available on the website of the iShares Core S&P Total U.S. Stock Market ETF (ITOT).
Created by the author using data from the ETFs
As it can be seen, all three funds are overweight in IT, though FFLG has a bit smaller exposure to that sector. In this trio, it also has the largest allocation to communication services. Another notable detail is that it is more bullish on industrials and more skeptical about financials than SCHG and FELG.
Growth
On the growth front, FFLG is a bit ahead of its counterparts, with the weighted-average revenue, EBITDA, and EPS growth rates being the highest. However, the nuance here is that these ratios are bolstered mostly by NVDA.
| Parameter | FFLG | FELG | SCHG |
| Holdings (as of July 15 for FFLG and FELG, as of July 16 for SCHG) | 91 | 104 | 247 |
| Revenue Fwd | 20.3% | 18.3% | 18.2% |
| EPS Fwd | 29.7% | 27.6% | 27.2% |
| EBITDA Fwd | 37.6% | 32% | 31.4% |
| Quant Growth B- or better | 74.4% | 67% | 69.1% |
| Quant Growth D+ or worse | 17.4% | 23.4% | 20.4% |
| NVDA weight | 13.6% | 11.44% | 11.3% |
Created by the author using data from Seeking Alpha and the ETFs. Financial data as of July 16
Value
All three funds are seemingly priced for perfection. However, FFLG has a bit lower WA market cap as well as the smallest EV/EBITDA ratio and the smallest exposure to stocks with a D+ Valuation grade or worse. The earnings yield was adjusted for the impact of unprofitable companies.
| Metric | FELG | FFLG | SCHG |
| Market Cap, $ trillion | 1.697 | 1.612 | 1.667 |
| P/S | 12.64 | 13.09 | 13.03 |
| EV/EBITDA | 34.85 | 32.36 | 36.85 |
| Adjusted EY | 2.53% | 2.48% | 2.46% |
| Quant Valuation B- or better | 1.7% | 2.8% | 1.1% |
| Quant Valuation D+ or worse | 95.1% | 93.4% | 96.1% |
Created by the author using data from Seeking Alpha and the ETFs
Quality
I like FFLG’s quality profile, yet it is clearly not the best in this peer group. It has the smallest Return on Assets and the adjusted Return on Equity (the outliers with either a negative or above-100% ROE were removed). Its allocation to stocks with a B- Profitability grade or stronger is solid, but not the largest compared to those of FELG and SCHG. It also has too many loss-making companies in its portfolio.
| Metric | FELG | FFLG | SCHG |
| ROA | 20.2% | 19.0% | 19.2% |
| Adjusted ROE | 21.7% | 18.9% | 20.3% |
| Quant Profitability B- or better | 98.4% | 94.9% | 97.7% |
| Quant Profitability D+ or worse | 0.5% | 2% | 1.1% |
| Loss-making companies | 0.9% | 7.5% | 2.1% |
Created by the author using data from Seeking Alpha and the ETFs
Overall, while FFLG does have a few advantages, I would not say they are meaningful enough to choose it over the peers assessed.
Investor takeaway
This year, with the new strategy in place, FFLG has been a beneficiary of the growth style rotation, as the growth premia have been improving thanks to investors pricing in a return to accommodative monetary policy. However, it has been unable to best either SCHG or FELG.
Also, its trading history with a new strategy is too short. I believe FFLG has yet to prove itself. We do not know how FFLG would perform in a scenario with tech equities retreating from all-time highs they are currently hovering around. It is reasonable to expect a deep maximum drawdown on such an occasion. In this regard, it is also logical to anticipate its longer-term total returns to be closer to those of SCHG, but assuming differences in fees, the latter looks like a superior choice.
Seeking Alpha
All in all, while appreciating FFLG’s solid growth- and quality-heavy factor mix, I believe a Hold rating is an optimal one.
Read the full article here


