If you read various online message boards where gold bugs and junior gold miner stock investors comment, you might think that the past 3 years have been the worst gold and miners bear market of our lifetimes. Sentiment seems as low as it has ever been. Frustration with falling share prices of junior gold miner stocks is at an all-time high.
But the reality of the performance and trend of the gold price itself is quite different. Just 5 years ago, in late 2018, the gold price was around $1200/oz. Since then, gold has been in a strong bull market. I argue that it remains so to this day. Yes, in 2022 the Fed rate hike cycle and rising interest rates drove down the gold price — but not back down to $1050/oz (like 2015) or $1200/oz (like 2018)! At the lowest low, the gold price held solidly above $1600/oz. Then it rose sharply higher from there. As I write, the gold price is $1967/oz.
This is not bear market price action, this is typical action of a sharp correction within a gold bull market. In a true bear market, the gold price would fall almost 50%, as it did in 2011-2015. It did not even come close to doing that in 2022.
Honestly, one reason for the extreme negative sentiment right now is that many investors may feel burned: Late entrants may have bought gold miner stocks at or near the highs in the summer of 2020, got burned in the sharp correction of late 2020, and they may have gotten burned again in the sharp correction of 2022. Nevertheless, the precious metals sector as a whole is in a much more healthy shape today than it was in 2018 or 2015.
Falling Inflation Will Benefit Gold Miners
Of course, as most readers with an interest in the precious metal sector are well aware, there is a big difference between the performance of the gold price itself and that of gold miner stocks. Naturally all miners benefit when the price of their product rises, but like any business, that must be weighed against the costs they have to incur in order to explore, develop, construct, and mine their product. There is no doubt that those costs are rising in the inflationary environment of the present decade.
Here’s a contrarian perspective to consider: Perhaps the Fed rate hike cycle, as frustrating as it has been, will actually prove to be beneficial for gold miners in the long run. The rate hikes appear to be working toward their goal of bringing down inflation rates. This means holding back the rate of price increases not only for consumer items such as food, gas, and other everyday expenditures, but also for the items and materials that a gold mine developer and operator must buy.
If the gold price is resilient in the wake of the rate hike cycle, as it has been particularly since the correction low of autumn 2022, but the prices of mining input materials are at least better controlled as the pace of inflation moderates, this will be a better economic environment in which to operate for gold mine developers and producers.
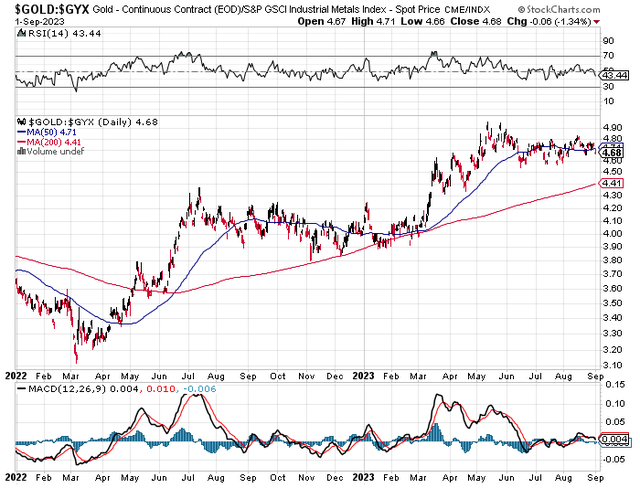
A couple comparative ratio charts may illustrate these trends to date in the present cycle. First, consider the ratio of the gold price to the Industrial Metals index GYX. The Industrial Metals index may serve as a type of proxy for the costs of industrial expenditures that a mine developer and operator must spend. Here is the chart of that Gold vs. Industrial ratio in 2022-2023, the period of the current Fed rate hike cycle:
StockCharts.com
As the chart clearly shows, the price of gold has steadily outperformed the price of industrial metals since last year. This is a very good trend for gold miners, since it indicates the potential for the price of their product they mine and sell to outperform the prices of the industrial materials they have to purchase to develop and operate their mines.
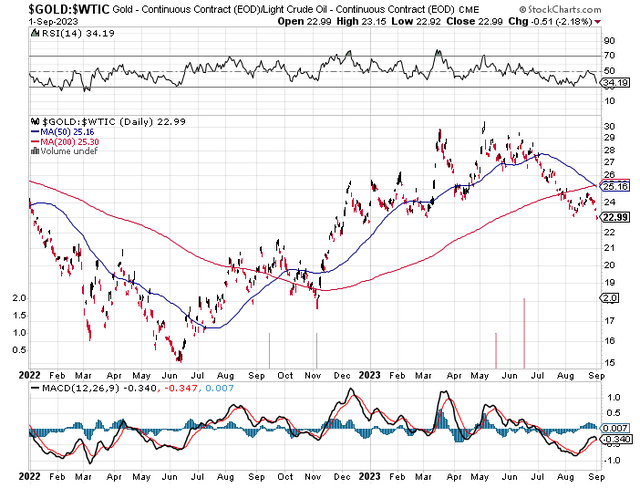
It is also well known that petroleum to operate vehicles and machinery is one of the major costs of mine development and operation. When central banks and governments take measures to hold down the price of oil, in order to benefit consumers (and voters) by holding down gas prices, this also benefits mine developers and operators by holding down one of their major operating costs. So the price ratio of gold to oil is also relevant as a comparison of a gold miner’s major source of revenue vs. a major cost.
StockCharts.com
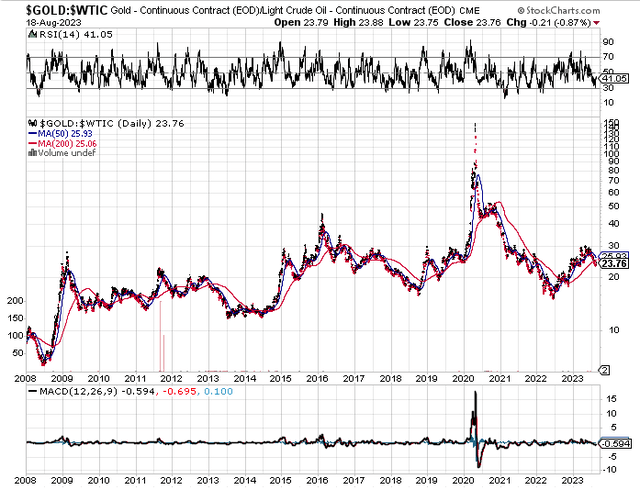
This chart reflects more volatility, since multiple unique factors impact the price of oil. Nevertheless, the overall trend is gold outperforming oil since last year. A much longer term chart of this ratio, all the way from back in 2008 up to the present day, also indicates long term steady outperformance of the gold price vs. the oil price:
StockCharts.com
A similar trend has been in place ever since the price of gold was allowed to trade freely in the early 1970s. Again, naturally there is great short-term volatility of this price ratio in both directions, due to the volatile nature of both the gold price and the oil price.
Buy Now or Wait Till New Year’s?
Many investors may be wary of buying shares of gold miner stocks at this particular juncture: In the past, the fall has often been a poor season for gold miner share price performance. On top of that, junior mining stock investors have especially come to fear the dreaded “tax loss selling season” near year end in November and December, when supposedly large numbers of shareholders sell their losing mining stocks at year end for tax purposes to offset presumable gains in other stocks in other sectors.
I have always felt that the fear of tax loss selling season is overblown. December is actually a good month for junior gold miner stock performance, statistically. Yes, January is often an excellent month for junior miner stock price rallies, but if you wait until the rally has already started in January, you may find yourself chasing a rising price, when it is quite difficult to time your entry to avoid overpaying. I always prefer to position myself in advance so I am not stuck in that situation facing difficult and tricky timing decisions.
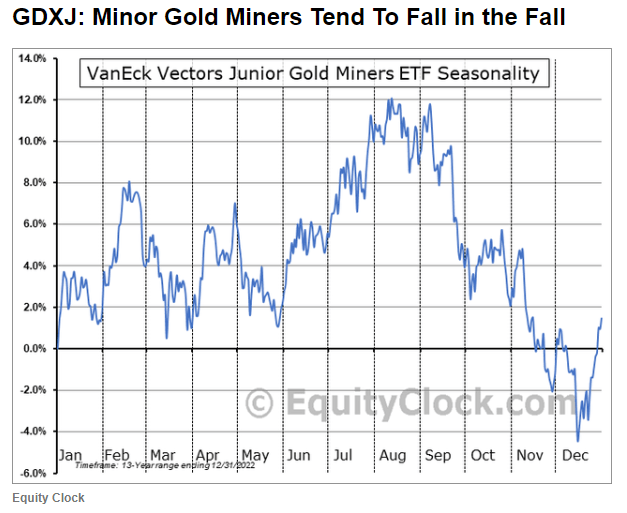
As for seasonal performance in September and the fall, yes the historical statistical seasonality has been poor for junior gold miners. Mike Zaccardi wrote about this issue in an article on this site in July, making a point which I respect. It is worth quoting here a VanEck Junior Gold Miners ETF (NYSEARCA:GDXJ) seasonality chart for 2010-2022 that was presented in that article:
EquityClock.com
Well yes, that decline from early September to mid-December looks nasty, doesn’t it?
However, we must keep in mind that seasonality is only a statistical average over many years. Generally speaking, we may conclude from the chart that junior gold miners are bullish in winter (mid-December to February), bearish in spring (March to May), bullish in summer (June to August), and bearish in autumn (September to mid-December).
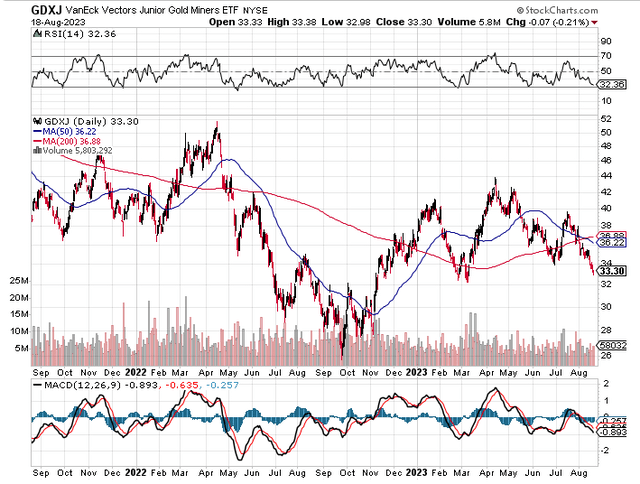
But we are not deciding whether to buy junior gold miner stocks in an average year from 2010 to 2022, we are deciding whether to buy them specifically now in early September of 2023. Looking specifically at last year and this year, 2022 and 2023, we do not see the typical “bullish summer” performance in the June-August period at all. The summers of 2022 and 2023 were just as bearish for GDXJ as the springs of 2022 and 2023 were:
StockCharts.com
On the other hand, after a final bottoming process played out in September 2022, autumn then became quite an excellent season for junior gold miners, with a strong rally from late September through January. Last year, those who decided to sit out and wait during the fall and buy in January made a big mistake.
Of course, each investor has to make their own decisions. You can sit out this fall and wait until January to buy junior gold miner stocks if you are afraid of the seasonality and the tax loss selling season. You can try to time the exact bottom, like those who bought in late September last year.
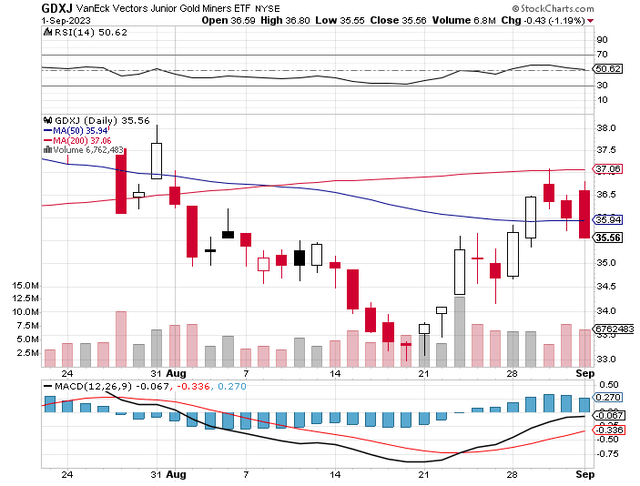
However, I would not be surprised at all if the actual bottom in GDXJ this year already happened, at the end of the awful week August 14-18:
StockCharts.com
Personally, I expect a very bullish performance from junior gold miner stocks during this fall and into the beginning of 2024.
Read the full article here


