Morningstar’s Best Dividend Stocks
On May 6 Morningstar published The 10 Best Dividend Stocks. Morningstar’s 10 Best Dividend Stocks
They noted “These undervalued stocks with reliable dividends are worth considering.”
The Morningstar 10 Best Dividend Stocks are blue-chip stocks – shares of well-established, financially stable companies. Morningstar noted that they carry a 4- or 5-star (their highest) rating, have narrow or wide economic moats, and are undervalued. They would be the epitome of SWAN – Sleep Well at Night companies to invest in. Morningstar’s 10 Best Dividend Stocks are below.
Morningstar’s 10 Best Dividend Stocks to Buy (Morningstar)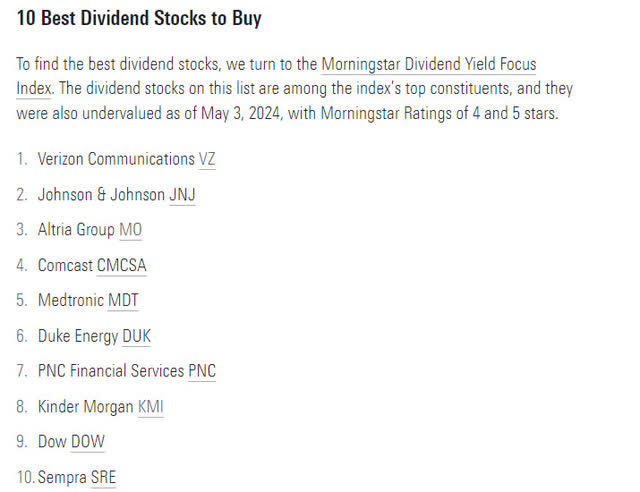
Morningstar gives a fair value estimate for each of the stocks. A list of the Morningstar stock’s dividend yield, ratio of price on May 24 compared to Morningstar’s fair value estimate, Morningstar’s rating and assessment of economic moat is shown below. I added the SPDR S&P 500 ETF Trust (SPY) for comparison using Morningstar’s estimate that the overall market is overvalued by 2% at the present time. Note that the dividend yields – DY – are as of May 24 using FASTGraphs estimates.
Morningstar’s 10 Best Dividend Stocks Attributes (Morningstar, FASTGraphs)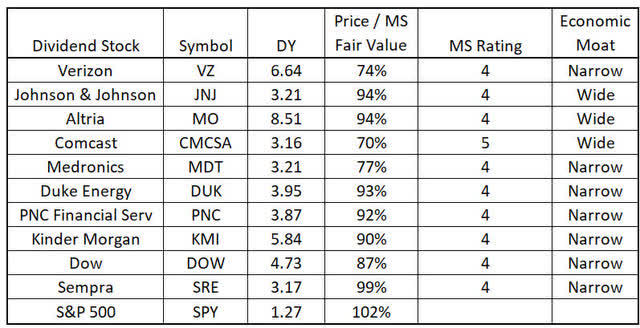
Valuation and Estimated Potential Total Return Analysis Approach
Morningstar did not discuss price earnings ratio, earnings growth rate, dividend growth rates, nor potential total future returns in their article. Their fair value estimated comes from a discounted cash flow analysis. In my opinion, selecting a stock based on dividend yield, safety, and discounted cash flow without considering other valuation metrics such as price multiple or potential total return is a job half done. I performed valuation analysis of each of the stocks then estimated their potential future total rate of return. I used FASTGraphs’s to estimate earnings growth from now through the end of 2026. I then computed each stock’s PEG ratio using Peter Lynch’s favorite metric – PE divided by earnings growth rate + dividend yield. That metric is particularly useful for dividend stocks which tend to have above average dividend but below average earnings growth rates. I then used FASTGraphs to estimate the potential total rate of return of each stock.
S&P 500 Valuation and Potential Total Return
I performed a valuation analysis of the S&P 500 (SPY) and estimated its potential future return. I did this to compare the potential total return of Morningstar’s 10 Best Dividend Stocks to investing in the S&P 500 instead. The analysis, summarized below, illustrates the analysis performed on each of the Morningstar 10 Best Dividend Stocks.
FASTGraphs calculates that the current blended PE of the S&P 500 (SPY) is 23.9. Earnings are expected to grow at an annual rate of 13.07% from now through the end of 2026. SPY has a 1.27% dividend yield. The S&P 500’s (SPY) PEG Ratio – PE/ (EGR + DY) – is 1.67. Above what Peter Lynch might deem optimum (less than 1) but surprisingly not that high given its runup in recent history.
The 20-year price performance of the S&P 500 is shown below. Adjusted (Operating) Earnings per share (EPS), EPS growth, and dividends are listed at the bottom for each year. The black line is historic stock price. The average annual earnings growth rate, from 2003 through 2026 is 7.84%. The average price multiple that the market has placed on the S&P 500’s earnings over the last 20 years has been 19 and the blue line shown is 19 times earnings. Over the last 20 years the price of the S&P 500 has oscillated above and below its 20-year average of 19 times earnings. It currently sits above its 20-year average signifying that the S&P 500 is currently overvalued. The blue line shows the price of the S&P 500 if its PE ratio was its 20-year average of 19 and earnings grow as estimated.
S&P 500 20-Year Performance (FASTGraphs)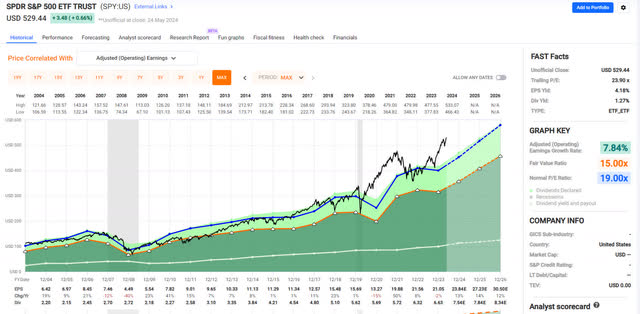
FASTGraphs estimates the S&P 500’s total return if that happens. As shown below, if the S&P 500’s PE reverts to its 20-Year average and it achieves its estimated earnings, its price would grow at an annual rate of 3.5%. Add its estimated dividend and the annual rate of return of the S&P 500 reverting back to its 20-year normal PE ratio would be 5.0%.
Return of the S&P 500 if PE reverts back to its 20-Year average (FASTGraphs)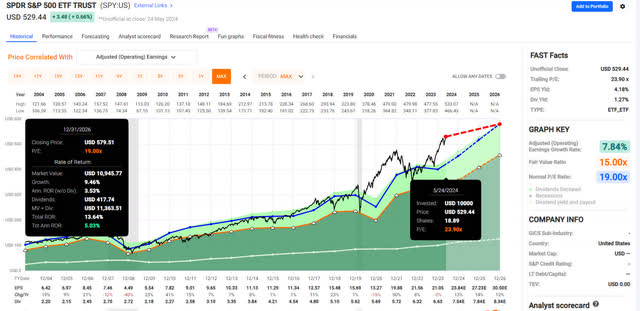
Over the last 5 years the S&P 500’s earnings have grown faster, and its price multiple has been higher than its 20-year long term average. The five-year look below shows that the S&P 500’s average annual earnings growth rate has been 8.85% and its average PE 21.18 compared to the 20-year 7.84% and 19 respectively. It is still overvalued compared to its recent 5-year average price multiple but less so. If the S&P 500 reverts to its 5-year average price multiple, it would give an average annual rate of return of 9.35%.
Return of the S&P 500 if PE reverts back to its 5-Year average (FASTGraphs)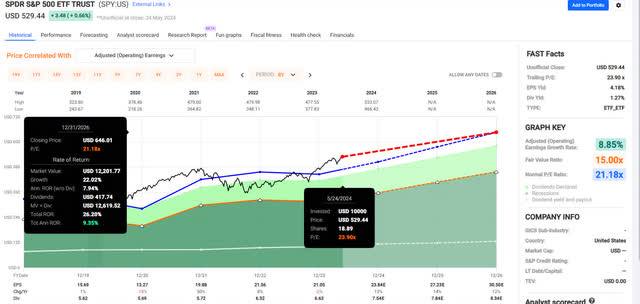
Finally, if the PE ratio of the S&P 500 did not change but remained at its current 23.9 price multiple, its rate of return would be its earnings growth rate plus dividend yield. That would give a (13.07 + 1.27) = 14.3% annual rate of return.
I averaged each of the three rates of return – S&P 500 reverting back to its 20Y price multiple, reverting back to its 5-year price multiple, or keeping its current multiple to produce an average potential rate of return through the end of 2026. That gives an estimate of a 9.6% annual rate of return through the end of 2026 for the currently overvalued S&P 500. This approach to estimating future returns uses all the information available – current price multiple, historic price multiple, best estimates of future earnings and dividends and I believe is an excellent approach to estimate potential future returns to compare different stocks as potential investments.
I used this approach to estimate Morningstar’s 10 Best Dividend Stocks future total return.
Valuation and Potential Total Return of Morningstar’s 10 Best Dividend Stocks
Verizon
The first stock listed by Morningstar is Verizon (VZ)(VZ:CA)
FASTGraphs calculates that the current blended PE of Verizon is 8.52. FASTGraphs estimates earnings will grow at an annual rate of 1.75% from now through the end of 2026. Verizon has a 6.69% dividend yield. Verizon’s PEG Ratio – PE/ (EGR + DY) – is 1.01. Quite a bit lower than the S&P 500.
The 20-year performance of Verizon’s stock is shown below. Average annual earnings growth rate, from 2003 through the 2026 estimate is 2.95%. Quite a bit lower than the S&P 500. The average price that the market has placed on Verizon’s earnings has been 13.57 times earnings and the blue line shown is 13.57 times earnings. The price of Verizon has oscillated above and below its 20-year average of 13.57 times earnings. Verizon’s price sits considerably below its 20-year average price multiple signifying that Verizon is currently undervalued. Earnings are expected to grow from now through the end of 2026. The blue line shows the price of Verizon if its PE ratio was its 20-year average and earnings grow as expected.
Verizon 20-Year Price Performance (FASTGraphs)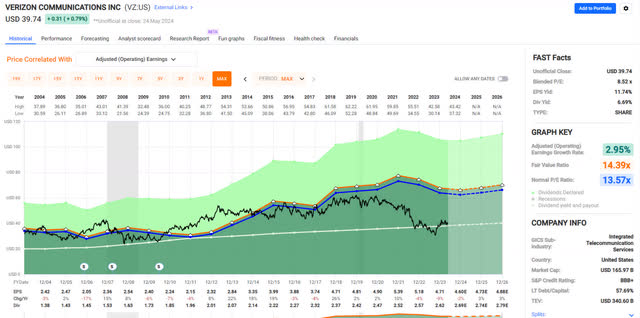
As shown below, if Verizon’s price reverts to its 20-year normal PE and it achieves its estimated earnings, its price would grow at an annual rate of 21.7%. Add its estimated dividend and the potential rate of return of Verizon using its 20-year mean PE ratio would be 26.4%.
Return of Verizon if PE reverts back to its 20-Year average (FASTGraphs)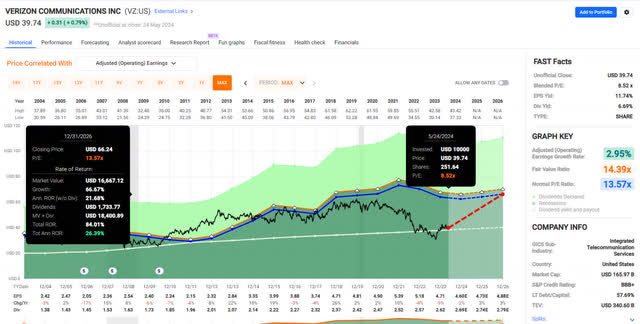
Verizon’s 0.45% average annual earnings growth rate over the last five years and 10.39 average price multiple has been a little lower than the 20-year 2.95% and 13.57 respectively. Verizon’s price fell when earnings fell after peaking in 2021. That said, its earnings are expected to begin growing again after 2024. If Verizon reverts to its 5-year average price multiple, it will return 15.3% annually from now through the end of 2026.
Return of Verizon if PE reverts back to its 5-Year Average (FASTGraphs)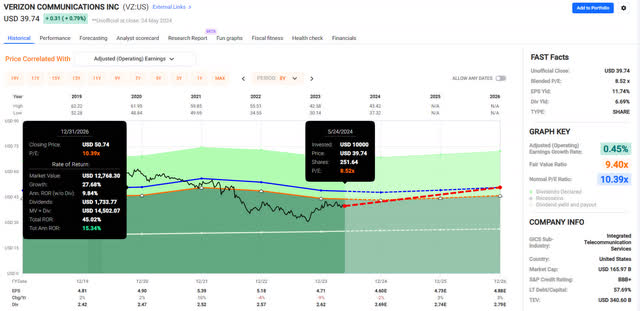
Finally, if the PE ratio of Verizon did not change but remained at its current 8.52 price multiple, its rate of return would be its earnings growth rate plus dividend yield. That would give a (1.75 + 6.69) = 8.4% rate of return.
Averaging the rates of each of the three rates of return gives a 16.7% estimated annual rate of return through the end of 2026 for the currently undervalued Verizon.
Comcast
Comcast (CMCSA) has the highest potential rate of return of all of Morningstar’s 10 Best Dividend Stocks.
FASTGraphs calculates Comcast’s current Blended PE is 9.45. Comcast’s earnings are expected to grow at an annual rate of 9.16% from now through the end of 2026. Comcast has a 3.22% dividend yield. Comcast’s PEG Ratio – PE/ (EGR + DY) – is 0.76. Quite a bit lower than the S&P 500 or Verizon. It would meet Peter Lynch’s desire for stocks with PEG’s below 1.0.
Shown below is Comcast stock’s 20-year performance. 15.58% average annual earnings growth rate is double the S&P 500’s. The average price multiple that the market has placed on Comcast’s earnings has been 17.54 and the blue line shown is 17.54 times earnings. Its current price sits significantly below its 20-year multiple signifying that Comcast is significantly undervalued. Earnings are expected to continue to grow as shown. The blue line shows the price of the Comcast if its price multiple reverts to its normal 20-year average PE while its earnings grow as estimated.
Comcast’s 20-Year Price Performance (FASTGraphs)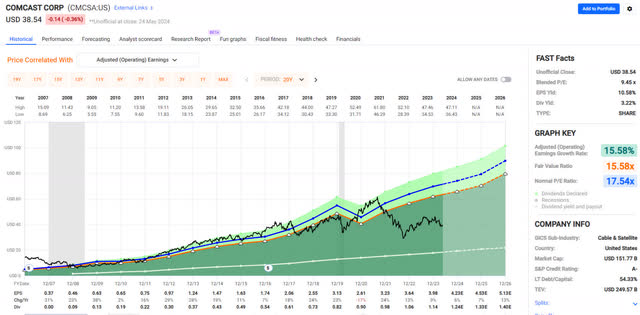
As shown below, If Comcast’s price reverts to its 20-Year mean and it achieves its estimated earnings, its total return, price growth + dividend, would be over 40% annually. Total return would be over 140%.
Return of Comcast if PE reverts back to its 20-Year average (FASTGraphs)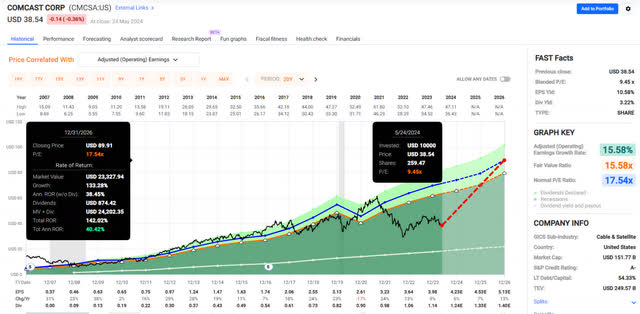
Comcast’s 9.12% five-year average annual earnings growth rate and 13.58 average PE have been a little lower than the 20-year 15.58% and 17.54 respectively. Its current PE is 9.45 compared to its 13.58 5-year average. If Comcast reverts to its 5-year average price multiple, it will give an average annual rate of return of 27.8%.
Return of Comcast if PE reverts back to its 5-Year average (FASTGraphs)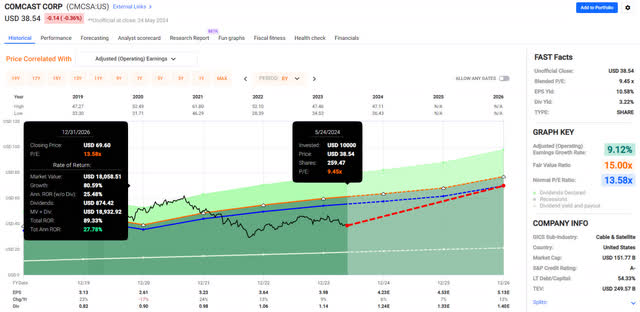
If the PE ratio of Comcast did not change but remained at its current 9.45 price multiple, its rate of return would be its earnings growth rate plus dividend yield. That would give a (9.16 + 3.22) = 12.4% rate of return.
Averaging the rates of each of the three rates of return gives an estimate of a 26.9% annual rate of return through the end of 2026 for the currently undervalued Comcast.
Summary of Valuation and Estimated Return of Morningstar’s 10 Best Dividend Stocks
I performed the above analysis for each of the remaining Morningstar dividend stocks. The table below summarizes the key data, valuation, and estimated return of each stock. The stocks are ordered by estimated return, from the highest Comcast to the lowest Sempra.
Valuation and Estimated Rates of Return of Morningstar’s 10 Best Dividend Stocks (FASTGraphs, Morningstar, Author)
Comcast currently has the lowest ratio of price compared to Morningstar’s estimate of fair value. Sempra has the highest. The next valuation measure – current PE divided by 20-year average PE; Comcast has the lowest valuation 54% of its 20-year average PE while Duke Energy has the highest with its PE being 9% higher than its 20-year average PE signifying that Comcast is significantly undervalued while Duke Energy is overvalued. Note that DOW’s current history only goes back to 2019. Its current PE is 42% above its 5-Year average.
The third valuation measure PE / (EGR + DY) shows DOW, Altria, and Comcast are the most undervalued and Johnson & Johnson, Duke Energy, Sempra and Medtronic the most overvalued. Finally Average Estimated Rate of Return (ROR) is the average of the rates of return of each stock if the price multiple returns to its 20-year, 5-year, or maintains its current PE. Comcast has the highest estimated rate of return while Sempra has the lowest.
The chart below compares the estimated rates of return to current price divided by Morningstar’s fair value estimate.
Estimated Rate of Return versus Price to Morningstar’s Fair Value (FASTGraphs, Morningstar, Author)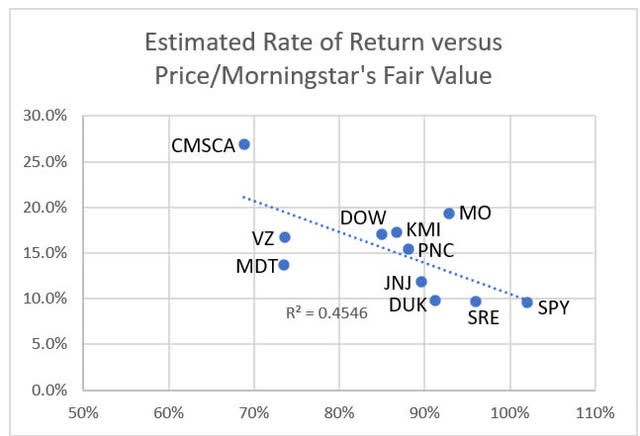
Morningstar uses a discounted cash flow approach to estimate fair value. That approach is fraught with issues such estimating a company’s cash flow many years into the future and determining an appropriate discount rate with the resulting fair value sensitive to errors in those assumptions. Plus, most individual investors do not run discount cash flow analysis before investing. That said, the estimated rate of returns calculated and the stock price to Morningstar’s Fair Value generally agree on which stock is a better value investment.
Estimated rate of return versus the PEG valuation metric is shown below. PEG is a useful valuation metric, but it treats all stocks equally. It does not consider what the market has actually paid for a dollar of earnings for different companies. That said, the estimated rates of return and PEG ratios correlate very well.
Estimated Rate of Return versus PEG Ratio (FASTGraphs, Author)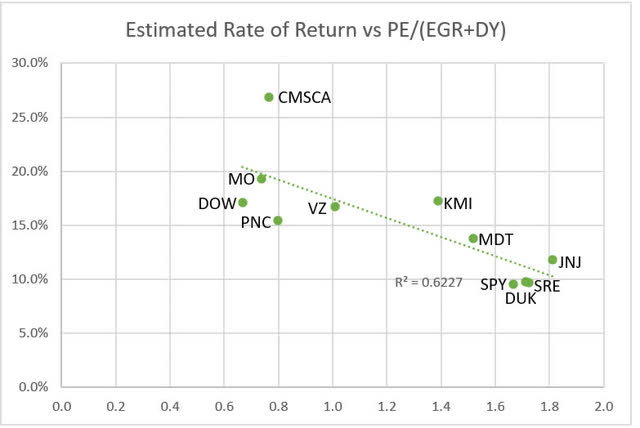
The Best Morningstar 10 Best Dividend Stocks
The chart below compares the dividend yield of Morningstar’s 10 Best Dividend Stocks to their estimated total rate of return. I like using this chart to compare dividend stocks. As a retired investor, I am interested not only in high dividend yields but also with total return. The blue line below is my “goodness line”. I am willing to purchase a stock with zero dividend yield if it has an estimated return about twice the S&P 500’s. I will trade dividend yield for higher total return. I would be willing to purchase a stock with a 10% dividend yield but only has a 10% estimated rate of return. This is the bird in hand worth two in the bush scenario, trading off potential total return for the higher probability dividend return. Also, a stock which gives a 10% dividend with 10% total return would, by definition, have zero price appreciation. That return would be analogous to a bond but with about twice the yield of current government bonds.
Stock Dividend Yield versus estimated Rate of Return (FASTGraphs, Author)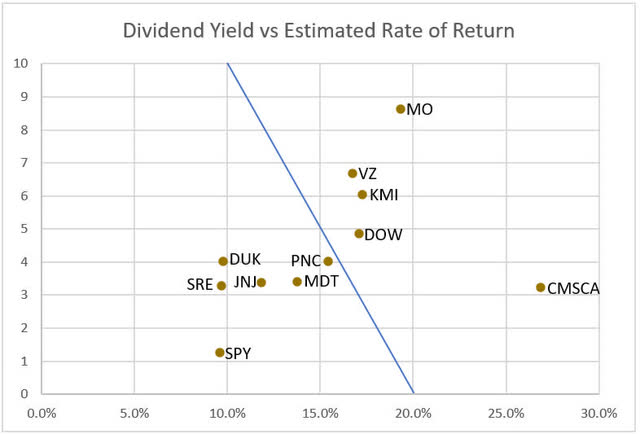
Stocks to the right of the line are better investments, have higher estimated returns for the same dividend yield, than stocks to the left of the line. MO, VZ, KMI, DOW, and CMCSA appear to be superior investments than PNC, DUK, SRE, JNJ, MDT. They are blue chip narrow to wide economic moat companies that have higher dividend yields and potentially higher total returns than the S&P 500. Those are the best Morningstar 10 Best Dividend Stocks. If one purchased all 5 stocks, they would provide a 5.9% aggregate average yield and a 19.5% aggregate estimated total return. The aggregate would give 5 times the S&P 500’s yield while having an estimated total return twice that of the S&P 500.
Risks to Investors
There are two principal risks to investors. The first is that the companies fail to achieve their estimated earnings per share. The five best companies are blue chip companies with multiple analysts following them and with fairly well predicted earnings. FASTGraphs provides an analyst scorecard, and the companies tend to meet their earnings estimates. Verizon, for example, met its two years out earnings estimate 92% of the time and beat it 8% of the time. Comcast also met its two-year earnings estimates 92% of the time and beat it 8% of the time. Duke Energy met its earnings estimates 100% of the time. Kinder Morgan had the worst record, beating estimates 27%, meeting 27%, and missing 45% of the time.
The second risk is that these undervalued stocks continue to remain undervalued and do not revert back to their longer-term price multiples over the next 2 1/2 years. If this happened and the PEs of five stocks noted above did not change, their price would still appreciate at their earnings growth rate of 10% annually while an investor would collect a 5.9% dividend yield being paid to wait for them to revert to fairly valued.
Read the full article here


