Investment Summary
Guardant Health, Inc. (NASDAQ:GH) has popped onto our radar given its depressed market values and long-term selloff. The question is, has the market accurately reflected GH’s investment potential in its current appraisal of the company, or, are there reasons to think these are too pessimistic, thereby presenting an investment opportunity?
As a reminder, GH is a precision oncology company that uses proprietary tests, vast data sets, and advanced analytics to provide care to patients at all stages of the disease. GH has commercially launched several tests, including:
- Guardant360 LDT and Guardant360 CDx for advanced-stage cancer
- Guardant360 TissueNext tissue test for advanced-stage cancer
- Guardant Reveal blood test to detect residual and recurring disease in early-stage colorectal, breast, and lung cancer patients, and
- Guardant360 Response blood test to predict a patient’s response to immunotherapy.
The Company books its revenues through providing these precision oncology testing services, as well as development services. Precision oncology testing involves genomic profiling and providing other genomic services from the company’s portfolio. Development services include its GuardantConnect and GuardantINFORM offerings, and things like companion diagnostic development, clinical study setup, and so forth. It recognizes a sale on the transfer of goods to its customers, not beforehand.
This analysis will look at several factors feeding into the GH investment debate, namely:
- The price implied expectations in its current market values
- Any evidence to confirm or deviate from the market’s views, using sound economic principles
- Valuations, including market-generated data and technicals.
Based on this analysis, my estimation is the market has priced GH within a fair value range, and that a breakout from here could be unlikely. In that vein, I rate GH a hold.
Figure 1. GH 3-year price evolution. One way ticket south since ’21 highs
Data: Updata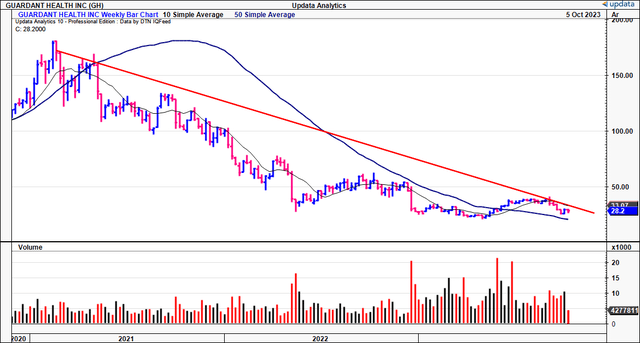
Figure 1(a). GH Long-term (monthly) price action, now back at listing range
Data: Updata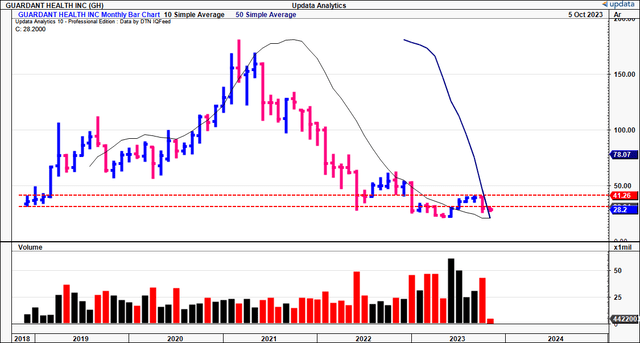
Critical facts pattern + findings in support of hold rating
1. Price implied expectations
It is critical to gauge what’s priced into GH’s current market values using sound economic principles.
In summary, I estimate the market has the following expectations:
- A 22% growth rate in sales to $548–$549mm.
- A 28.5% required rate of return to make the risk/reward attractive given the current scenario.
Sales growth rate
At a $3.32Bn market cap, the company trades at 6.05x forward sales, implying the market expects $548.7mm in FY’23 revenues from the company or 22% YoY growth (3,320/6.05 = $548.7). Note, this is within management’s forecasts of $545–$555mm at the top this year.
Required rate of return
Based on consensus estimates out to FY’25, and the company’s guidance, I estimate this growth will increase to ~23.3% on avg. over the coming 5 years (Figure 1(c)). Afterwards, I’ve capitalized the company’s sales at a 12% hurdle rate, equivalent to 1) long-term market rates, and 2) our required rate of return. The market’s required rate of return on GH is the discount rate needed to discount these estimates to the current market value of $3.32Bn at the time of writing. As you can see, based on these assumptions, the market has a 28.5% required rate of return on GH, with ranges of 26%–40.5%, depending on various scenarios.
This tells me, that:
(i). There is outsized risk priced into the company’s market values as we speak, evidenced by the high required rate of return,
(ii). Investors expect a high sales growth rate into the coming years but won’t be prepared to pay high multiples.
BIG Insights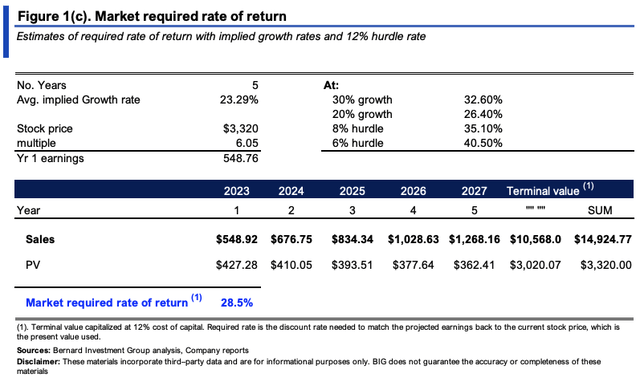
2. Confirmation/deviations from market expectations
The question is what evidence is there to suggest we should deviate from the market’s consensus on either side of the trade.
In my opinion, there are 3 factors to consider:
(1). Current and projected sales ramp,
(2). Value drivers, including investment requirements into NWC/fixed capital,
(3). What the company can produce growing at its steady state.
Current and projected sales ramp
GH has been expanding its top-line at a reasonable clip, with TTM revenues up from $287mm in 2020 to $510mm last period. As seen in Figure 2 however, operating losses on this are deepening, amounting to $158mm in the TTM. Note, these figures are adjusted for R&D. It is capitalized on the balance sheet as an intangible investment, then amortized in a straight line over a 7 year period. Management projects $555mm at the upper end of range for FY’23 sales, and there’s reason to consider this number in my view. For one, this number was raised from $535–$545mm previously.
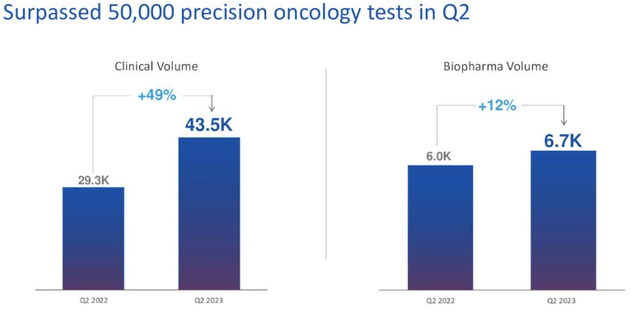
Second, the company surpassed 50,000 precision oncology tests in Q2 FY’23, bringing in $125mm for the quarter ($500mm annualized). This comprised 43,500 clinical tests, up 49% YoY and 11% sequentially, with an average selling price (“ASP”) of $2,700. Biopharma tests were also up 12% YoY to 6,700 tests. Third, the company is increasing the number of covered lives across its entire portfolio. It is “approaching 200 million covered lives and hope[s] to cross this threshold later this year” according to management, this, alongside reimbursement in Japan for its Guardant360 CDx, effective from July. Management also said Japan is currently its “largest expansion opportunity for our portfolio of products outside of the U.S.“, with >1mm new cancer diagnoses each year.
So there is reason to believe the expected sales ramp could continue at a 22–24% rate over the coming few years. This appears to be what’s reflected in GH’s current stock price.
BIG Insights Source: GH Q2 Investor presentation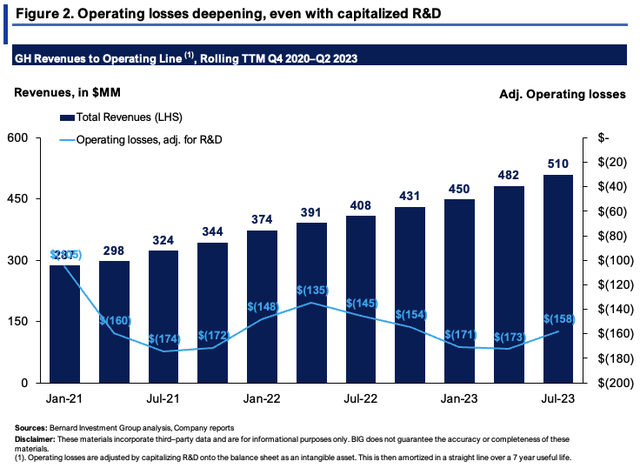
Value drivers, inc. sales + investments
GH’s critical value drivers over the past 2 years are noted in Figure 3. The numbers are taken on a rolling TTM basis to provide an 8-period look-back window. Sales have compounded at ~6% each period over this time, on negative operating margins, as described earlier.
Crucially, the following data points stand out from this analysis:
- The bulk of GH’s investment has been geared towards its NWC requirements. I have included all cash on hand in this calculus. Usually, you’d consider cash a non-operating asset, but given the firm’s rate of cash burn, it is an operating asset in this instance (cash on hand has reduced from $938mm in Q2 2021 to $271mm last quarter, a 71% decrease).
- Each new $1 in sales required a $2.03 investment to NWC (inc. cash) over this time. One might argue the $2.03 per $1 NWC investment created the sales growth outlined earlier. But with the heavy use of cash, I’m not sure I would agree.
- Further, it has sized up its investment to fixed assets by $0.05 for every $1 in sales growth.
I’d also point out that GH has reduced the amount of total assets employed on the balance sheet from $2.27Bn in 2020 to $1.84Bn last quarter, but capital deployed directly at risk into operations has remained reasonably flat at ~$1.5Bn. Still, the company is rotating $0.17 in gross for every $1 in assets employed, up from $0.09 in 2020. For reference, a number >$0.3 is considered high.
This analysis suggests two things. One, that the company’s main investments are geared towards NWC, i.e., the day-to-day running of the company. This will consume plenty of cash moving forward, without necessarily adding to productive assets. Two, these investments haven’t shown efficiency just yet. Each $1 in sales growth required >$2 in investment, so the capital turnover isn’t quite there yet for the firm, at 0.33x last period. So you’ve got a fairly capital-intensive, unprofitable, low capital turnover business as a result.
BIG Insights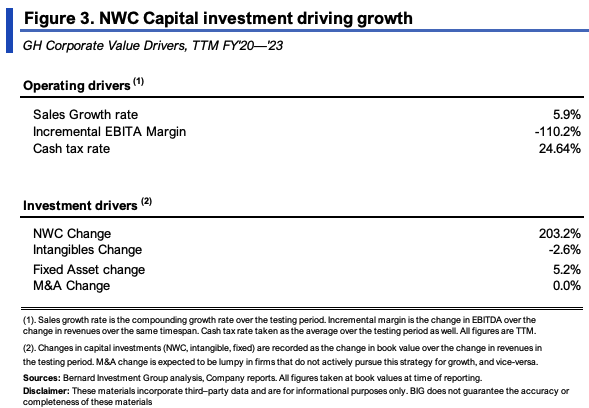
Expectations at steady-state and potential scenarios
The numbers presented in Figure 3 are reasonable to carry forward in my view. Annualizing the 5.9% sales growth rate gets to 24% forward sales expectations, in-line with the estimated market’s view from earlier.
Should it continue at this rate, the model in Figure 4 makes the following observations:
- Sales could push to $680mm by 2024, slightly ahead of the market-implied estimates presented in Figure 1(c).
- Investment requirements to grow to this level could range from $62mm to $78.45mm per quarter ($260–$288mm annualized). Keep in mind, current cash on hand is $270mm, despite raising $350mm at $28/share in May. Also, this is above the market’s view on reinvestment rates outlined earlier.
- But capital turnover would remain low at ~0.3–0.4x, meaning each $1 in investment would return back $0.40 in sales at the upper range.
This presents a challenging set of economics to work with. On the one hand, sales growth could be high. On the other, the investment requirements will be equally as high, 42% of sales at the upper range of estimates, 70% of gross profits. Plus, the capital intensity means these investments might not be efficient in generating growth in future sales.
With this in mind, it starts to make a little more sense why investors have compressed GH’s market values to such low levels.
BIG Insights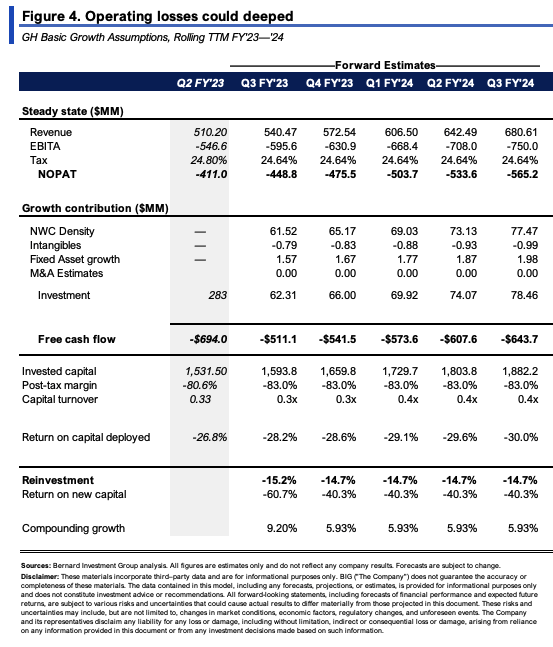
Valuation
The stock sells at 6.05x forward sales, as mentioned. My estimates have the company doing $572mm in FY’23 revenues, and at 6.05x forward, this derives a market value of $3.46Bn or $29 per share. Note, this is trading within the current share price as I write. In my opinion, this valuation is well supported in the facts that 1) GH is unprofitable and will likely need to raise more cash (unable to internally fund its growth route), 2) there is high risk in this name given the economics and high capital requirements with no FCF, and 3) Lack of identifiable catalysts to suggest a sharp price change.
Market-generated data is supportive of this as well. Figure 5 shows the daily cloud chart with GH’s price and lagging lines well below the cloud. It tried to test the cloud base rolling into October, but was rejected sharply, and has since pulled away from this mark. This supports a neutral view.
Figure 5.
Data: Updata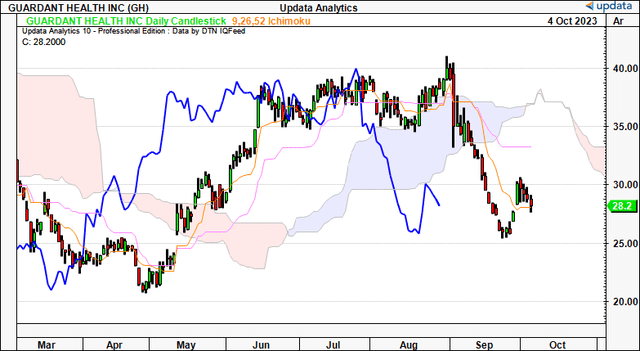
Conversely, the point and figure studies seen in Figure 6 seem to imply an upside target to the $34 region. This is something to consider, as it would bring GH back to its previous range. However, it’s not enough of a dislocation from current market prices to get me over the line. I’d be looking more to the $40 region as an upside target to warrant a buy rating. This absence is indeed noted, supporting the neutral view.
Figure 6.
Data: Updata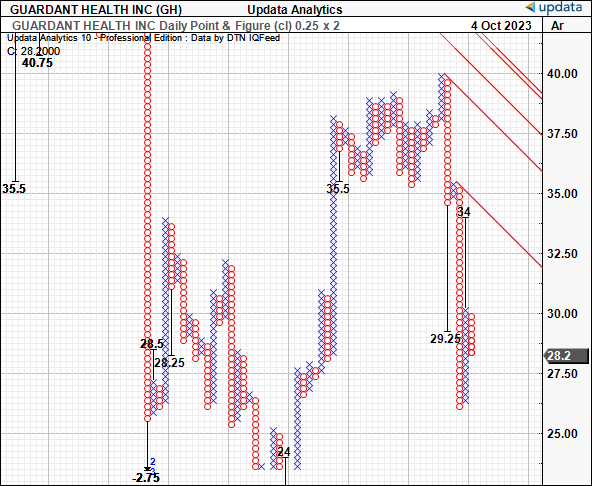
Discussion of facts pattern
Based on the comparative analysis in price implied expectations and sound economic analysis of GH’s fundamentals, it can be deduced:
(i). The market’s expectations for 22–24% top-line growth appear well supported in the data.
(ii). The estimated required rate of return investors are asking is not as well supported, given lack of gross profitability relative to assets, and an NWC-heavy growth model.
(iii). Related to the point above, given the firm’s deepening operating losses and capital-intensive nature to NWC, cash burn may continue to be a theme for the company’s growth route. This could mean more cash will need to be raised.
(iv). A lack of identifiable catalysts to suggest a sharp reversal in the current market sentiment.
Cumulatively, this assessment deems that a neutral rating is therefore well supported for GH. The company is serving a novel purpose, and there is no denying this. In the investment context, there is the question of opportunity cost (i.e., does GH outpace the next best investment with a similar or lower risk), and the fact markets are choppy as I write and in my view only the most robust business models will continue to catch a bid in the event of a market storm. As a result of this analysis, net-net, I rate GH a hold.
Read the full article here


