Research Brief
In today’s analysis, I will be covering Regions Financial (NYSE:RF), which is in the banking sector, and regional banking subsector.
Since may last coverage of this stock in June, when I gave it a buy rating, the share price has gone up by 1.92%.
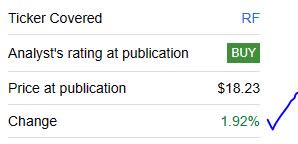
Regions Financial – price increase since last rating (Seeking Alpha)
The company had its most recent 2023Q2 quarterly earnings result on Jul. 21st, and that will be the reference data used in some parts of today’s analysis.
For readers less familiar with this company, which is listed by Wikipedia as #31 on the list of largest banks in the US, here are some relevant points to mention from their company website:
A member of the S&P500 index, key market regions are the south / Midwest / Texas, roots go back to 1970, does business across multiple banking segments including consumer / commercial / wealth management.
A few key peers of this company include regional banking groups Huntington Bancshares (HBAN) and M&T Bank (MTB).
Research Methodology
To determine a holistic rating for this stock of buy, sell, or hold, I split my research into the following 5 categories: dividends, valuation, share price, earnings growth, capital strength.
Each category has equal weight. If I recommend the stock in at least 4 of 5 categories, it gets a buy rating. 3 out of 5 will get a hold rating, and below that earns a sell rating.
This process is aimed to simplify things, focus on financial fundamentals, and to analyze an equity from multiple angles.
Dividends
In this category, I will discuss whether this stock should be recommended for dividend-income investors, by analyzing official dividend data from Seeking Alpha.
As of the writing of this article, the forward dividend yield is 5.17%, with a payout of $0.24 per share on a quarterly basis.
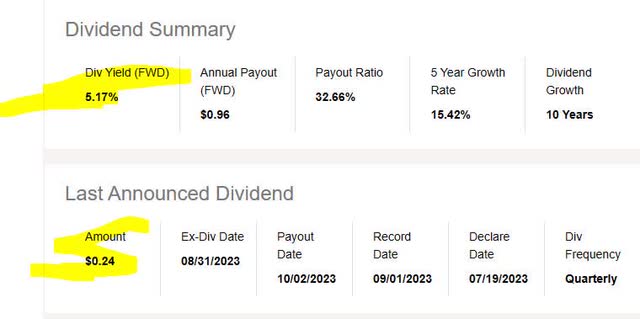
Regions Financial – dividend yield (Seeking Alpha)
Although an above 5% dividend yield may be attention-grabbing, I am also interested in how it compares to the overall sector. Turns out, it is beating the sector actually.
In comparing the yield vs the sector average, this stock is above the sector average by 34%. I think that is a positive for the dividend investor to think about in terms of this stock vs the overall sector it is in.
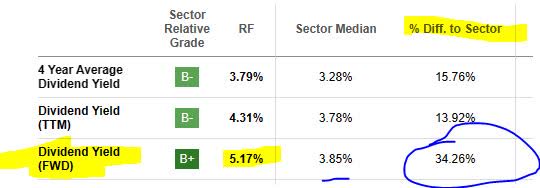
Regions Financial – dividend yield vs sector average (Seeking Alpha)
Next, in comparing the current dividend to the last 5 years, this company has been on a steady uptrend when it comes to dividend growth. I think this is also a positive for dividend investors as it points to the historical capacity of this company to return capital back to shareholders, though not necessarily a guarantee of future dividends.
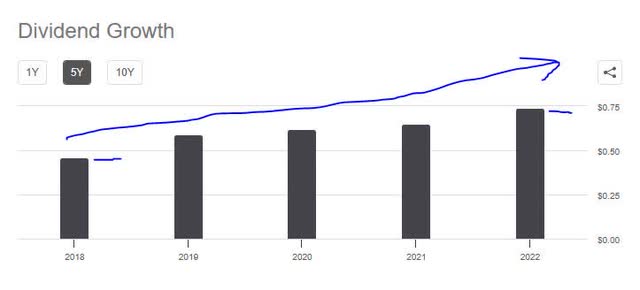
Regions Financial – dividend 5 year growth (Seeking Alpha)
Based on the evidence found, I would recommend this stock in the category of dividends. In the section on share price later on, I will show how annual dividend income can play a role in putting together my investment idea for this stock.
Valuation
In this category, I will discuss whether this stock presents an attractive valuation for investors who are value-oriented. To analyze this, I will use today’s valuation data from Seeking Alpha and specifically the forward P/E ratio and forward P/B ratio.
This stock’s forward P/E ratio shows the price being 7.92x forward earnings, which is 18.69% below the sector average that is hovering closer to 9.75x forward earnings. I am looking for a valuation in a range that is up to 30% below the average or in line with it and up to 5% above average.
This is because in my opinion if it appears ridiculously undervalued compared to its sector average, let’s say 80% below average, that should warrant further study into what is driving that valuation down for this stock.
In this case, this stock is reasonably valued on price-to-earnings when compared to the sector it is in. I would be accepting of valuations up to 10x earnings for this sector right now actually which I think is reasonable.
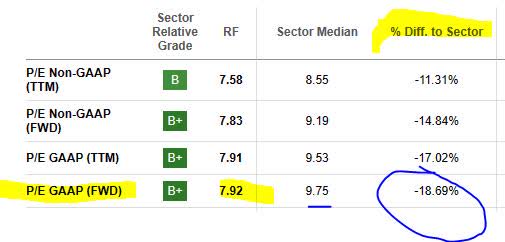
Regions Financial – P/E ratio (Seeking Alpha)
This stock’s forward P/B ratio shows the price being 1.10x forward book value, which is 8% above the sector average that is hovering around 1.01x forward book value. My benchmark is a valuation in a range that is up to 30% below the average or in line with it and up to 5% above the average. In this case, this stock is reasonably valued on price-to-book value, even though it appears slightly higher than the average. I think up to 2x book value in this case could be acceptable for this sector.

Regions Financial – P/B ratio (Seeking Alpha)
Since this stock is reasonably valued on both valuation ratios, I would therefore recommend it in the category of valuation, based on the evidence researched.
Share Price
In this category, I will decide if the current share price presents a value buying opportunity or not.
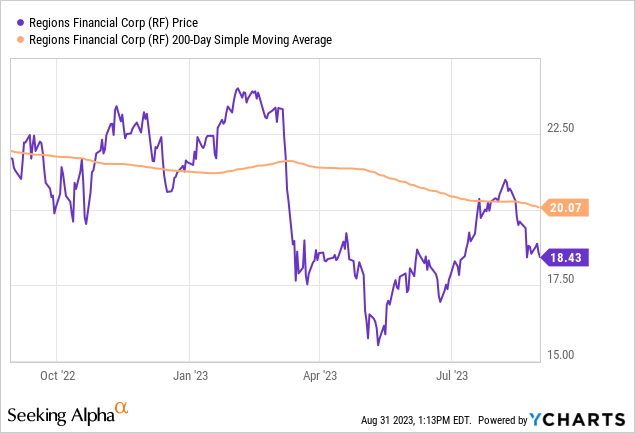
First, I pulled the most recent YChart as of this article writing. It shows a share price of $18.43 and compares it to its 200-day simple moving average “SMA” of $20.07, tracked over the last year.
Then, I created a simple investing simulation where I am testing a potential gain and loss scenario. The simulation below buys 10 shares at the current price, holds for 1 year until Aug. 2024 to earn a full year of dividend income in theory, and sells the shares then.

Regions Financial – investing simulation (author analysis)
The first sell scenario assumes the current SMA will rise by 10% in a year and that is my target sell price, with a profit goal of achieving +10% overall return on capital. As you can see in the simulation, I achieve +25% which exceeds my goal.
The 2nd sell scenario assumes the current SMA will drop by 10% in a year and I will be forced to sell at that price, my risk tolerance being a negative return on capital of -10%. However, in the simulation I achieve a +3.22% positive return. This is because the dividend income offsets the capital loss.
Because the two trading simulations met the profit goal and remained within my risk tolerance for loss, I would recommend the current share price as a buying opportunity, considering it priced just right.
This investing idea, however, may not fit all investors’ portfolio goals or risk tolerance, and should only be considered an oversimplified way to think about this stock as a long-term investment and in terms of potential gains as well as potential losses that could occur.
Give the simulation a try and in the comments section I welcome your feedback on your own simulation results!
Earnings Growth
In this category, I will analyze the earnings growth trend for this company over the last year, using data from the income statement on Seeking Alpha as well as the most recent company quarterly earnings release, presentation and commentary.
First, a key driver of money-making for banks is interest income but a key cost is interest expense on things like deposit accounts, so I am glad to report that the “net” interest income, or spread between interest revenue & expense, has shown positive YoY growth at this bank, after the Q2 results:

Regions Financial – net interest income YoY (Seeking Alpha)
Next, the total top-line revenue results also came in strong, with YoY growth in that figure as well. Further, you can see a mostly upward trend in revenue since June 2022.

Regions Financial – revenues YoY (Seeking Alpha)
The bottom line saw a slight YoY drop, however, though nothing too major.

Regions Financial – net income YoY (Seeking Alpha)
A major source of earnings for this bank is its loan book, so one data point I look at is whether they are achieving YoY loan growth. It appears they are, as the charts below show, so they are achieving loan growth across both consumer and business segments.
I think this should correlate with a higher interest-income trend but also growth in fees earned that may be associated with writing those loans.
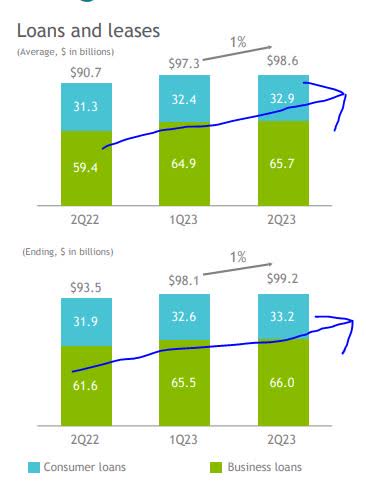
Regions Financial – loans growth YoY (company Q2 presentation)
Based on the evidence, I would recommend this stock in the category of earnings growth.
Capital Strength
In this category, I will analyze the capital strength for this company using data from the company recent quarterly presentation and earnings release, that shows financial viability of this firm.
The CET1 ratio, an important metric in banking and a regulatory standard, has shown YoY growth for this bank, a positive sign.
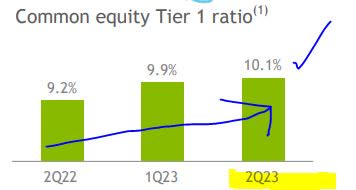
Regions Financial – CET1 ratio (company Q2 presentation)
Also relevant for investors is the liquidity situation at this bank, particularly in the wake of the spring turbulence at regional banks and recent media stories about credit downgrades at some banks.
Here is official company commentary on their liquidity strength at the end of Q2:
The company’s liquidity position also remains robust as of June 30, 2023, with total available liquidity of approximately $53 billion, which includes cash held at the Federal Reserve, FHLB borrowing capacity, unencumbered securities, borrowing capacity at the Federal Reserve’s discount window, and the Federal Reserve’s Bank Term Lending Plan facility.
This is good news, but also a reminder of what some of us know already that banks like this can tap into multiple sources of liquidity especially the Fed.
According to the company’s Q2 comments, “given current macro-economic conditions & regulatory uncertainty, anticipate continuing to manage CET1 at or modestly above 10% over the near term.”
Based on the evidence, I would recommend this stock in the category of capital strength.
Rating Score
Based on passing 5 of my 5 rating categories above, this stock earned a strong buy rating today, which is an upgrade from my June rating of buy. This rating is more bullish than the consensus from analysts and much more bullish than the quant system, as shown by the graphic below.
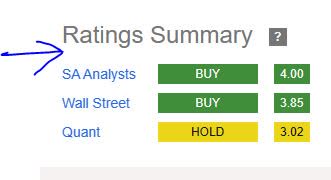
Regions Financial – ratings consensus (Seeking Alpha)
Risk to my Outlook
My bullish outlook on this stock could be impacted by the August media stories about credit downgrades of several banks by ratings agency Moody’s.
According to CBS News on Aug. 9th, Regions Financial was one of 11 banks whose outlook was shifted from stable to negative.
Some of the reasons for this were given:
the current higher-interest rate environment is knocking down the value of investments lenders made when rates were super low.
Smaller banks are especially at risk, given that they have sizable unrealized economic losses” that could cause investors to lose confidence.
My counterargument when it comes to Regions Financial is that based on their own data from Q2 they are anticipating that unrealized losses on their available-for-sale securities portfolio are actually decreasing and expected to continue to decrease. This should help the situation.
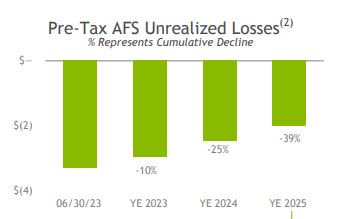
Regions Financial – AFS securities, losses decline (company Q2 presentation)
Also, the company provided in their presentation more detailed insight into their securities exposure:
$1.1B high quality, investment grade corporate bond portfolio is short-dated (2.2 year duration) and well diversified across sectors and issuers.
Pre-Tax unrealized losses on AFS Securities expected to decline ~25% by year end 2024 and ~39% by year end 2025.
So, I think the evidence points to what is in my opinion an unjustified negative outlook by Moody’s, and I have already shown that this bank has multiple liquidity sources so should not be forced to sell a lot of these assets at a realized loss.
Analysis Summary
To wrap up today’s analysis, let’s go over the key points discussed:
This stock received a strong buy rating today.
Its positive points included: dividend yield, valuation, share price, earnings growth, capital strength.
The risk of exposure to unrealized losses on bonds has been addressed.
Concluding Thoughts and Downside Risk
Regions Financial continues to be on my watchlist of regional banks, as not only a dividend quick-pick but also having solid financial fundamentals at a reasonable valuation.
At the same time, one cannot ignore the potential downside risk as well. Again, it is worth mentioning the Moody’s downgrade from the CBS News article discussed earlier.
The risk seems to be tied to asset exposure, whether it is exposure to declining bond values or exposure to certain real estate loans for office space. This issue is not limited to this bank or its regional bank subsector, though, as it appears according to the article that several banking giants have also been put “under review”, and this includes Bank of New York Mellon (BK) and State Street (STT), to name a few.
I think that the market has already priced this downgrade in, and we already saw the share price dip below the SMA in August:
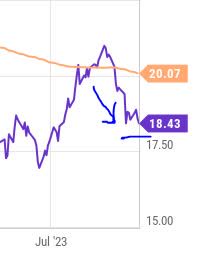
Regions Financial – price dip (yChart)
I still think it is in good buying territory right now, but that does not mean it cannot drop further due to this downside risk mentioned. Then again, as mentioned in the section on “share price”, in my opinion it should be looked at from a longer-term perspective and I have shown how someone can test a potential loss scenario and their risk tolerance, before deciding if it is the right buy price for them or not.
Read the full article here


