Introduction
I recently came across a set of 18 ETFs managed by JPMorgan offered under the BetaBuilders logo. JPMorgan describes the basic strategy behind this set of ETFs in the following terms.
“Our leading market cap-weighted ETFs, BetaBuilders, are portfolio building blocks that track indexes from well-respected firms like Morningstar, MSCI and Bloomberg Barclays. Backed by J.P. Morgan’s 30+ years of indexing experience, they leverage the technologies and trading power of one of the world’s largest asset managers to deliver broad market exposures at lower costs.”
Source: am.jpmorgan.com betabuilders
Of those not yet reviewed on Seeking Alpha, I chose to first cover the JPMorgan BetaBuilders U.S. Mid Cap Equity ETF (BBMC) since I was in the midst of reviewing other Mid-Cap ETFs. The JPMorgan BetaBuilders International Equity ETF (BATS:BBIN) was the other non-reviewed but popular one in this series and is reviewed in this article. For those investors who believe the USD will weaken from here, the BBIN ETF gets a Buy rating as a Core ETF for International Developed equity exposure. Other ideas are mentioned at article’s conclusion for other investors.
JPMorgan BetaBuilders International Equity ETF review
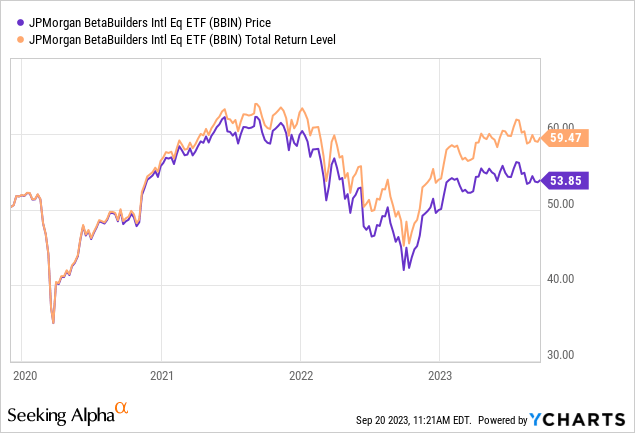
Seeking Alpha describes this ETF as:
“JPMorgan BetaBuilders International Equity ETF was launched and managed by J.P. Morgan Investment Management Inc. It invests in public equity markets of global ex-US/Canada region. The fund invests in stocks of companies operating across diversified sectors. It invests in growth and value stocks of companies across diversified market capitalization. The fund seeks to track the performance of the Morningstar Developed Markets ex-North America Target Market Exposure Index, by using full replication technique. The BBIN ETF was formed on December 3, 2019.”
Source: seekingalpha.com BBIN
BBIN has $3.75b in AUM and has just 7bps in fees. The TTM yield is a respectful 2.56%. For a Core ETF, the low fees are a big plus!
Index review
When considering an index-invested ETF, reviewing the index is a critical part of the due diligence process. Morningstar describes their index as:
“The Morningstar Developed Markets ex-North America Target Market Exposure Index targets large- and mid-cap stocks in developed markets outside North America, representing the top 85% of the investable universe by float-adjusted market capitalization. This Index does not incorporate Environmental, Social, or Governance (ESG) criteria.”
Source: Morningstar Developed Markets ex-North America Target Market Exposure
The Index is rebalanced quarterly and reconstituted semi-annually. There are no special selection rules for this index. It does exclude Emerging market stocks. Ignoring factor-based or actively-managed ETFs in this market segment, there doesn’t seem anything special about the index so results is what matters.
Holdings review
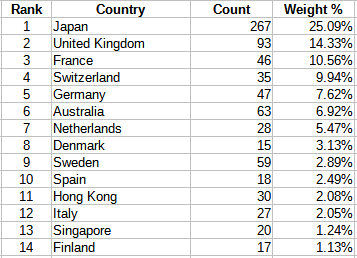
BBIN has exposure to 28 countries, with 14 having a weight over 1%.
am.jpmorgan.com; compiled by Author
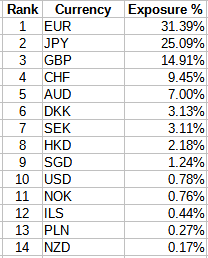
The top three countries comprise 50% of the portfolio exposure. With some countries sharing currencies and the fact BBIN does not hedge that risk, here is where that exposure lies:
am.jpmorgan.com; compiled by Author
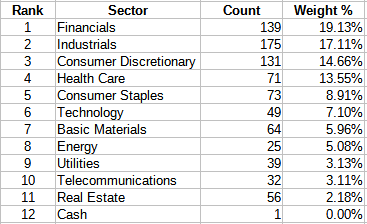
The Top 4 currencies are over 80% of the portfolio’s exposure. For investors worried about currency risk, there are ETFs that hedge for this, some of which I have reviewed (and prefer). Next to be considered is sectors. Along with country, sector exposure differences between ETFs will affect their relative returns.
am.jpmorgan.com; compiled by Author
Here, the Top 3 sector represent 50% of the portfolio weight, with the Top 2 close in their allocation. Based on Morningstar’s destinations, the top sectors are a mix from across their spectrum.
Top holdings
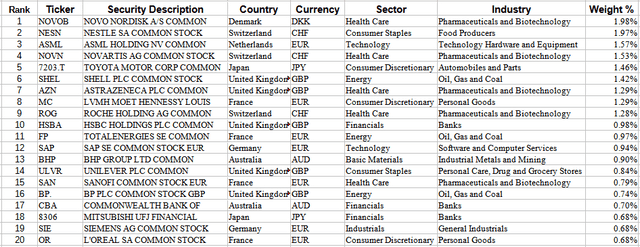
The manager included Industry classifications too, which is nice to have.
am.jpmorgan.com; compiled by Author
These stocks account for 23% of the portfolio, which holds over 800 positions. That is the same weight as the smallest 590 positions have in the portfolio. With no stock over 2% in weight, BBIN cannot depend on a few stocks to driver performance, which can be a good thing, risk wise.
Distribution review

Seeking Alpha | Stock Market Analysis & Tools for Investors DVDs
As seems normal with International equity ETFs, the year-end payment is larger, especially for funds with large Japanese holdings. Even with a yield of almost 2.5%, BBIN is unlikely to be held for its income generation.
Comparing ETFs
To help understand how BBIN is performing, I will compare it against one of the other ETFs from JPMorgan, the JPMorgan International Research Enhanced Equity ETF (JIRE). JIRE benchmarks against the MSCI EAFE index but isn’t bound by it in its security selection process. The ETF has $5.3b in AUM, with fees of 24bps. The TTM yield is 2.35%.
When I compared the Vanguard Style boxes, there are only slight differences. JIRE has more Large-Caps than BBIN but other allocations are close, that being Growth versus Value stocks. Comparing countries only showed a large difference in the allocation to France, with JIRE having 3% more there. Most of the other weights were within a percentage point. Again, sectors showed little allocation differences, with JIRE’s Technology being 1% more the biggest spread.
Performance results
Seeking Alpha | Stock Market Analysis & Tools for Investors BBIN charting
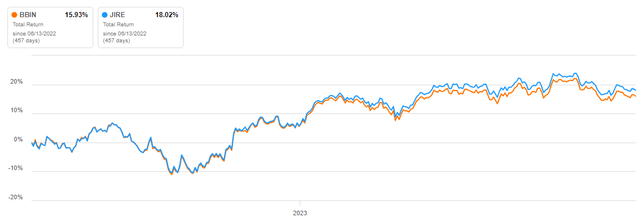
JIRE’s limited history as an ETF needs to be considered but since June’22, it has performed better than BBIN has. According to Portfolio Visualizer, risk data is close though favors JIRE in most cases. Both ETFs match or beat other ETFs based on popular international equity indices.
Conclusion
Looking at other index-based ETFs that invest in this market segment, BBIN’s best feature is it low fees, up to 25bps less than more popular ETFs that are its competitors. The underlying index is comparable to the ones used elsewhere and as I showed using the JIRE ETF, differences in major portfolio composition data can be small. Two other factors play a bigger role whether to use BBIN as Core ETF, those being how each investor feels about the strength of the USD and the desire for Emerging Market exposure.
Portfolio strategy
Reviewing International equity ETFs reminds me of the old Washington Senators baseball team. The common refrain at the time was: “Washington: First in war, first in peace, and last in the American League.”. With International stocks comparing poorly to US stocks over most recent time periods, who cares?

portfoliovisualizer.com
Well, the Senators won the American League three times and the World Series itself in 1924. As shown above, their one-year CAGR almost matched US LC stocks. A small allocation might make sense also from a diversification view since International stocks only have a 72% correlation to US stocks.
Not covered here but in other articles, is using a hedging strategy that has worked well when adding International exposure. I use both WisdomTree International Hedged Quality Dividend Growth ETF (IHDG) and the iShares Currency Hedged MSCI EAFE ETF (HEFA) for that part of the portfolio. I recently reviewed both ETFs.
Final thoughts
Either of these JPMorgan ETFs provide better results than the popular iShares MSCI ACWI ex U.S. ETF (ACWX), which includes Emerging Market stocks, thus both are potential International Developed buys for those who expect the US Dollar to weaken from here. I use both hedged and unhedged ETFs for my limited International equity exposure. A strategy to consider and very adjustable in splitting that allocation.
Read the full article here


