Analysis Summary
In today’s analysis, I will be covering United States Steel Corp. (NYSE:X), in the materials sector, subsector of steel.
From its profile, this Pittsburgh-headquartered firm trades on the NYSE and produces & sells flat-rolled and tubular steel products primarily in North America and Europe.
I gave this stock a hold rating, based on strengths being outnumbered by offsetting factors, however, not enough to warrant a sell rating.
Strengths: valuation, performance vs. S&P 500, capital & liquidity.
Offsetting factors: dividends, revenue growth, net income & EPS, share price vs. moving average.
A risk to my neutral outlook that I identified is uncertainty over the current takeover bids going on, as well as uncertainty over Q3 earnings results.
My rating methodology is to analyze the stock holistically across the following 7 categories of equal weight, and if it has more strengths than offsetting factors it gets a buy rating:
dividends, valuation, revenue growth, net income & EPS, capital & liquidity, share price vs. moving average, performance vs. S&P 500.
Dividends
In this section, I will go over the dividend yield, dividend growth over 10 years, and dividend stability of steady payouts. As a dividend-focused analyst and investor, I believe these are vital metrics to look at.
Though not all investors are dividend-oriented, I think it is an opportunity to generate regular cash flow from holding a stock longer-term.
First, let’s look at the yield, which is 0.62% as of this article, along with a dividend payout of $0.05 on a quarterly basis.
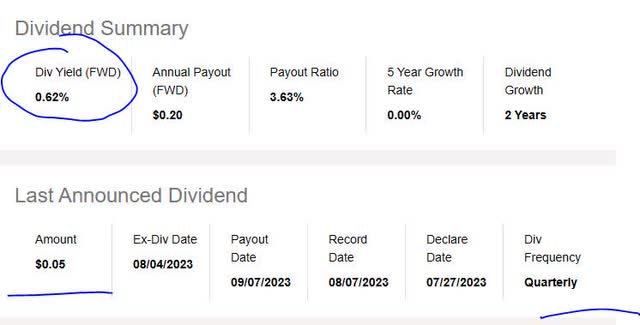
US Steel – div yield (Seeking Alpha)
In comparison to its sector average, this yield is 72.4% below the average. I consider this a negative point and I think a reasonable dividend yield would be between 2% and 4% when considering the sector/industry. One factor, however, that I know could drive a yield down is the share price skyrocketing upwards, which we will look at further later on. In fact, I suspect that is the cause.
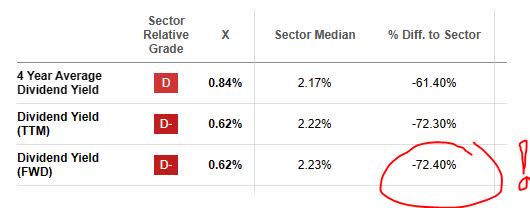
US Steel – div yield vs. sector (Seeking Alpha)
Next, I am looking at the 10-year dividend growth rate, shown in the chart below, which shows a long & steady period without much growth at all, followed by a major dip in 2020, then gradually growing again but only to recover from that dip, which I think was pandemic-driven since it was around that time.
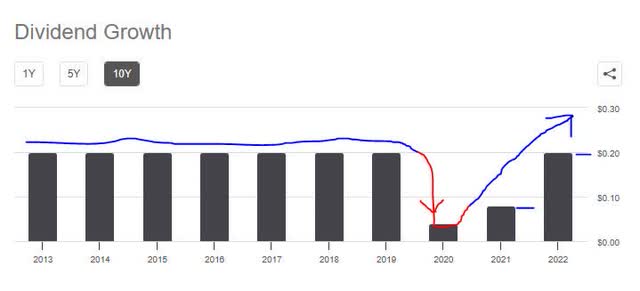
US Steel – div 10 yr growth (Seeking Alpha)
Finally, I want to see dividend payout stability, especially since many of my readers rely on the stable dividend income that these types of stocks offer.
In looking at the table below, you can see stable payouts over the last few years, with 1 dividend increase in this time. However, the payout is what I consider a paltry 5 cents per share, for a company that has been in business for so long and literally part of the American industrial story.
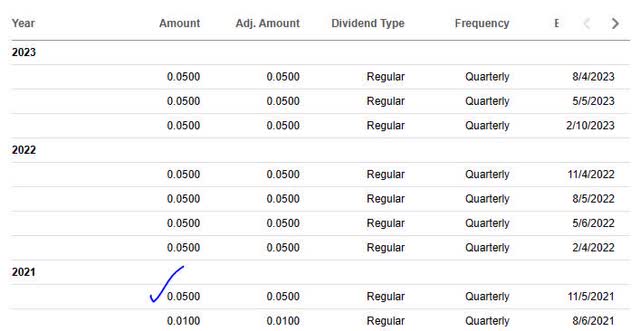
US Steel – div history (Seeking Alpha)
Based on the evidence, I consider the category of dividends an offsetting factor for this stock’s rating, on the basis of poor long-term dividend growth, a yield far below average, and only slightly offset by the stability of payouts.
Valuation
To analyze the valuation, I have chosen a single metric to look at, and that is the price-to-earnings ratio (P/E), both the trailing and forward P/E, which quickly tells me a story about where the market is pricing this stock in relation to its earnings.
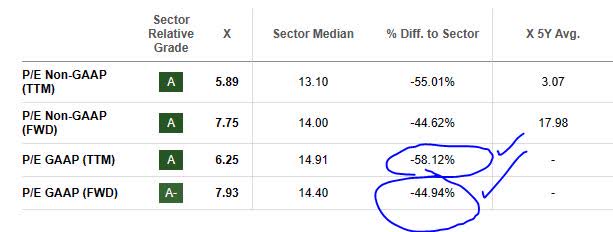
US Steel – PE ratio (Seeking Alpha)
Considering that the TTM P/E of 6.25 is 58% below the sector average, and the forward P/E of 7.93 is 43% below the sector average, I consider this stock greatly undervalued compared to its industry.
I think that it is due to the market sentiment not being optimistic about earnings, which I will show in a later section have been suffering.
In terms of an opportunity, I think this valuation metric is a strength for this stock’s rating since it presents an undervaluation opportunity that someone could snag while it’s still around.
Revenue Growth
Now, we’ve come to a topic many analysts & investors look at, which is the top-line revenue growth. The story it tells is how well a firm is growing its sales before expenses and taxes come into play.
For this company, we can see from the most recent quarterly results that it achieved a YoY drop in total revenue:

US Steel – revenue growth (Seeking Alpha)
When segmenting net sales by business line, according to its Q2 earnings release the firm did worse in most of its lines except for tubular steel.
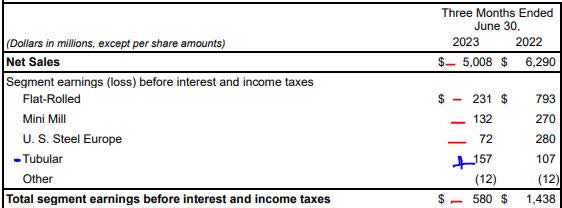
US Steel – net sales (company earnings release)
Therefore, I think revenue YoY growth is an offsetting factor for this stock’s rating, and am awaiting better results for Q3.
Net Income & EPS
I wanted to separate the bottom-line data from top-line revenue, so net income & earnings per share get their own section here to make the analysis easier to understand.
When looking at the most recent quarter, this firm faced a YoY drop in both net income and EPS:
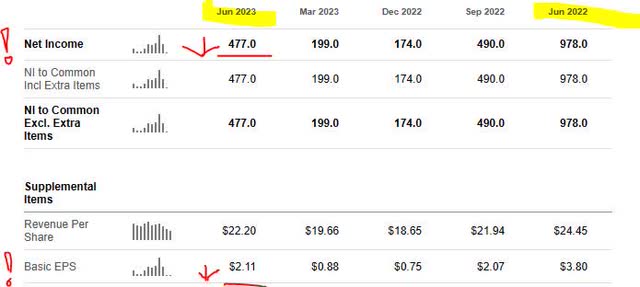
US Steel – net income & EPS (Seeking Alpha)
I think that this is another offsetting factor for this stock’s rating, even though the firm showed QoQ growth in both. From a longer view, it is not at the profitability level it was in the same quarter a year prior.
Turning to the company’s Q2 presentation for some more understanding into headwinds, some “unfavorable impacts” affecting business include lower average realized prices, higher scrap costs, higher labor costs, and higher variable comp.
Capital & Liquidity
In this section, we want to focus on the fundamentals of whether this company is well-capitalized, has positive equity, positive cash flow, and so on. I think these are important factors to consider and are among the very basics of any serious business.
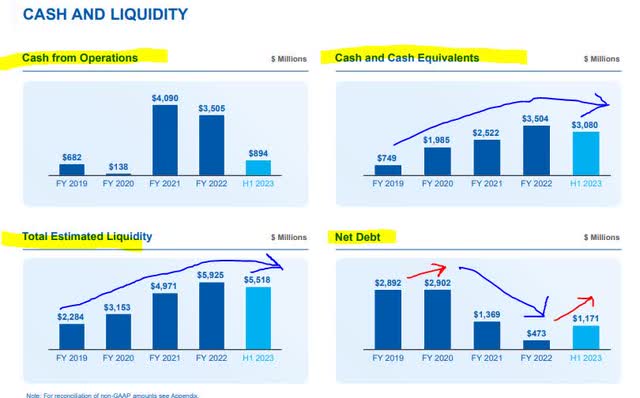
Turn your attention to the following graphic. The story it tells is that the firm’s cash has been generally increasing as has overall liquidity. Debt went on a nice decline, but then spiked back again, though still at lower net levels than a few years ago. Reduction of company debt is something I look for in productive management, especially considering the skyrocketing cost of debt in the current high interest rate environment.
US Steel – cash & liquidity (company quarterly presentation)
Other noteworthy items to call out:
balance sheet items: $3.08B in cash, $20.3B in total assets, $9.49B in total liabilities, and $10.81B in positive equity. I tend to favor companies with steady history of positive equity, which this one has.
cash flow statement: $0.44 per share in positive free cash flow. Also a good sign, I think.
Based on the evidence found, I consider this firm’s capital & liquidity situation a strength to its overall rating.
Share Price vs. Moving Average
In this section, I am looking for a value-buying opportunity with this stock based on my portfolio strategy of trading crossovers below the 200-day simple moving average (“SMA”). In my strategy, I consider a 5 to 10% drop below the 200-day SMA, after a period of bullishness, a buying signal. However, a price hovering at or near the SMA could also present a buy opportunity.
This is why I came up with a very simple trading simulation to test out my thesis.
First, let’s take a look at the current price chart (as of the article writing, so live results may vary):
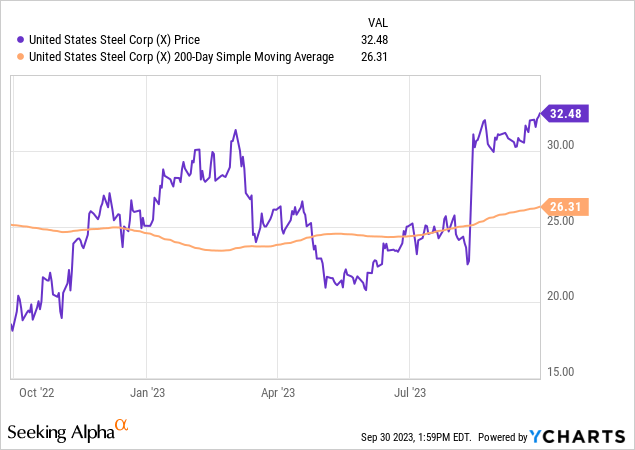
The share price as of the writing of this analysis is $32.48, which is 23.4% above the 200-day SMA of $26.31. At first glance, it appears overbought and not a value opportunity. However, we should take it for a test drive first!
Using this data, I created the following trading simulation where I buy 100 shares at this price and hold for 1 year, with a goal of achieving an unrealized capital gain at that time within a range of 5% to 20% gain or better. At the same time, my maximum loss tolerance is an unrealized capital loss of 20%.
Note: it is “unrealized” because no shares are being sold so it is just paper gains & losses.

US Steel – trading simulation (author analysis)
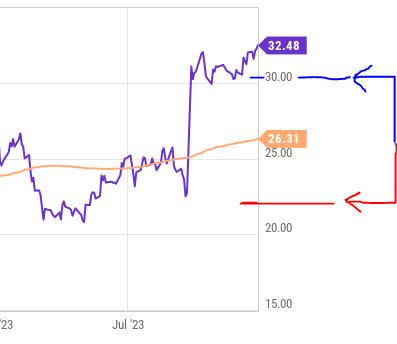
In the above simulation, I am testing what gains/losses would occur if the future share price (in Oct. 2024) rises 15% above the current 200-day SMA, and if it drops 15% below that same SMA.
The outcome? I project a capital loss of -6.85% in the first scenario and an even bigger loss of -31.15% in the 2nd scenario. Both outcomes are not in line with my portfolio goals & loss tolerance.
Here is a handy illustration of what I am talking about. As you can see, the blue arrow shows the price at 15% above the SMA and the red arrow shows the price at 15% below the SMA. The current share price is well above my upper limit, so a buy at this price poses a greater risk of capital losses exceeding my targets.
US Steel – trading simulation – loss limit (author analysis)
Consider this a simplistic example to be used as a framework, and may not be suitable for all portfolio goals, and not indicative of actual gains or losses that could occur.
However, based on this simulation, I think the current share price is an offsetting factor in my overall rating and does not add strength to it.
Performance vs S&P 500
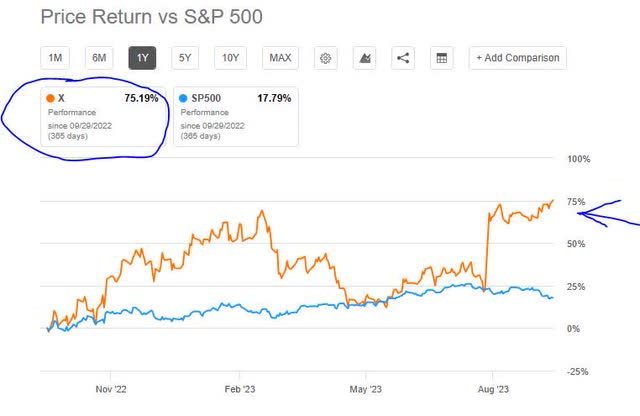
The following is a comparison of the 1-year price performance of this stock vs. the S&P 500 index. I think this is a vital index to compare against since it is a market standard that is often tracked.
US Steel – performance vs. S&P 500 (Seeking Alpha)
Evidently, the data shows the stock outperforming vs. this index, which I consider a strength.
In fact, the price return since Sept 2022 has been 75% whereas the index has seen a price return of closer to 18%.
Risk to my Outlook
A risk to my neutral outlook could be both a potential downside risk and upside risk.
Analysts and their consensus must be on the cautious side, since the firm has managed to beat earnings estimates for 4 quarters straight, and the question is will another earnings beat for Q3 send the stock price even higher?
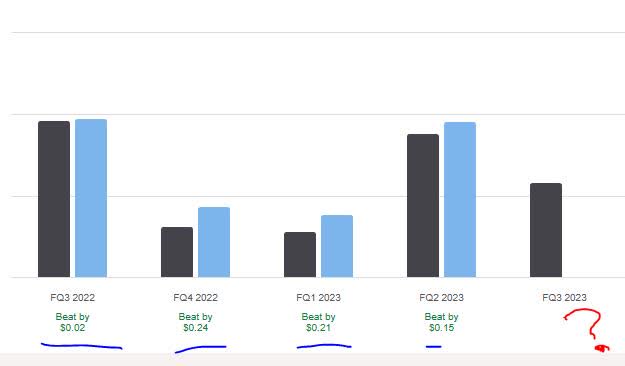
US Steel – earnings estimates (Seeking Alpha)
That type of scenario would make a neutral rating overly cautious. In fact, the company in September released Q3 earnings guidance indicating it expects a positive diluted EPS of $1.10 to $1.15. An earnings miss, however, could send the share price tumbling at least somewhat.
Also, there is the overarching issue of the bidding war among several players in merging with US Steel, the key one being Cleveland-Cliffs (CLF). The latest on that, from a Sept. 28th article in Reuters, is that the two companies have agreed to a non-disclosure agreement (NDA).
Further from the article:
Reuters has reported that ArcelorMittal is one of the parties that has been working on a potential bid for U.S. Steel. Bloomberg News has also reported that Canadian steelmaker Stelco Holdings (STLC.TO) is pursuing a bid.
So, this takeover issue, which is not a done deal yet, casts a shadow of uncertainty over the future ownership of this company, in my opinion.
Hence, my neutral rating on this stock stands for now, as I do not see justification to be bullish on this equity nor bearish either as it is still a fine company and a major part of both the Fortune 500 as well as the US economy going back to the industrial era.
Read the full article here


